
Table of Contents
The MACD Indicator (Moving Average Convergence Divergence) is one of the most widely used trading indicators in technical analysis.

Whether you’re a beginner or an experienced trader, understanding how to use the MACD indicator effectively can significantly enhance your ability to identify trends, reversals, and potential entry or exit points.
In this comprehensive guide, we’ll dive deep into everything you need to know about the MACD indicator , including its full form, formula, settings, and how to trade with it.
If you’ve ever wondered, “What is the MACD indicator?” or “How to read the MACD indicator?”, you’re in the right place. Let’s get started!
What is the MACD Indicator?
The MACD indicator stands for Moving Average Convergence Divergence . It is a momentum oscillator that helps traders identify changes in the strength, direction, momentum, and duration of a trend. Developed by Gerald Appel in the late 1970s, the MACD has become a staple in technical analysis due to its versatility and reliability.
Key Components of the MACD
The MACD consists of three main components:
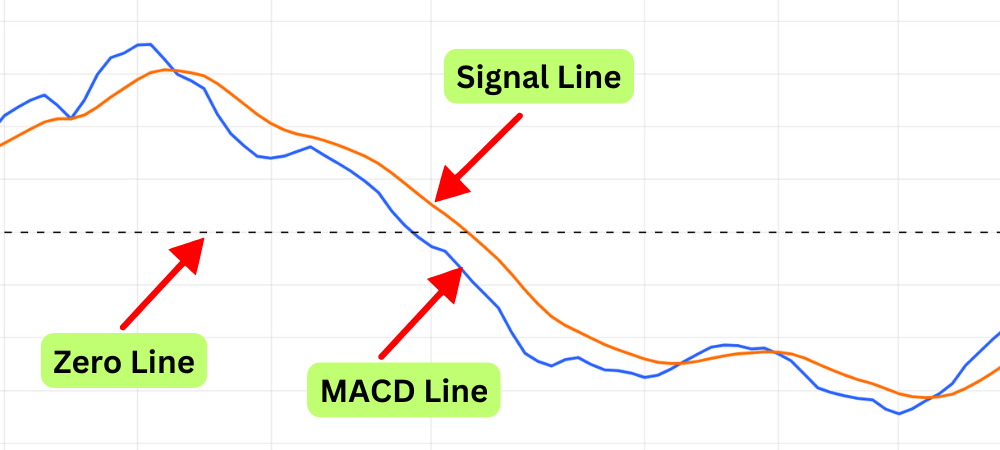
MACD Line :
Calculated as the difference between the 12-period Exponential Moving Average (EMA) and the 26-period EMA.
Formula:MACD Line=12-Period EMA−26-Period EMA
Signal Line :
A 9-period EMA of the MACD Line, acting as a trigger for buy or sell signals.
Histogram :
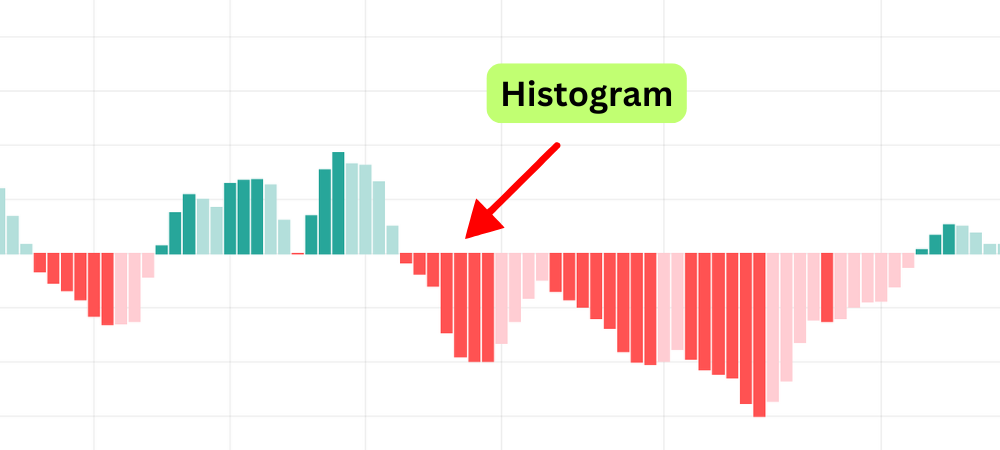
Represents the difference between the MACD Line and the Signal Line. It visually shows the strength of the trend.
Why Use the MACD Indicator?
The MACD indicator is particularly useful for identifying:
- Trend reversals
- Momentum shifts
- Potential entry and exit points
How to Read the MACD Indicator
Understanding how to read the MACD indicator is crucial for making informed trading decisions. Here’s a breakdown of its key features:
1. The Zero Line
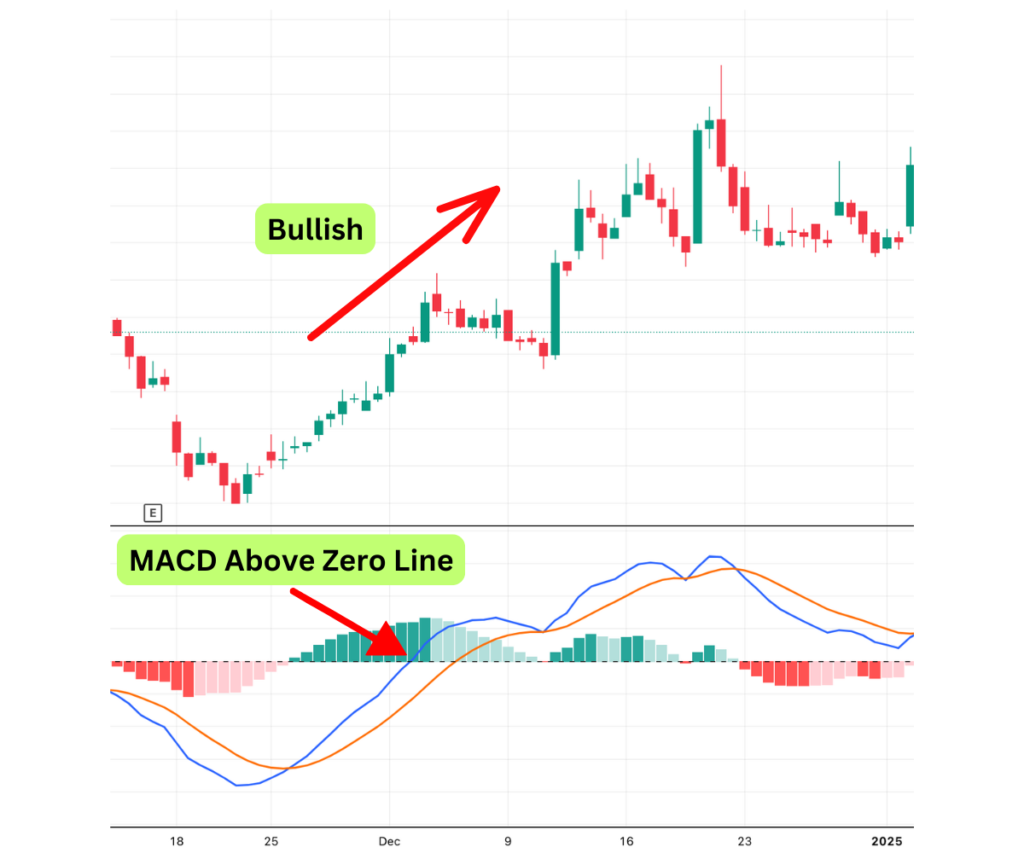
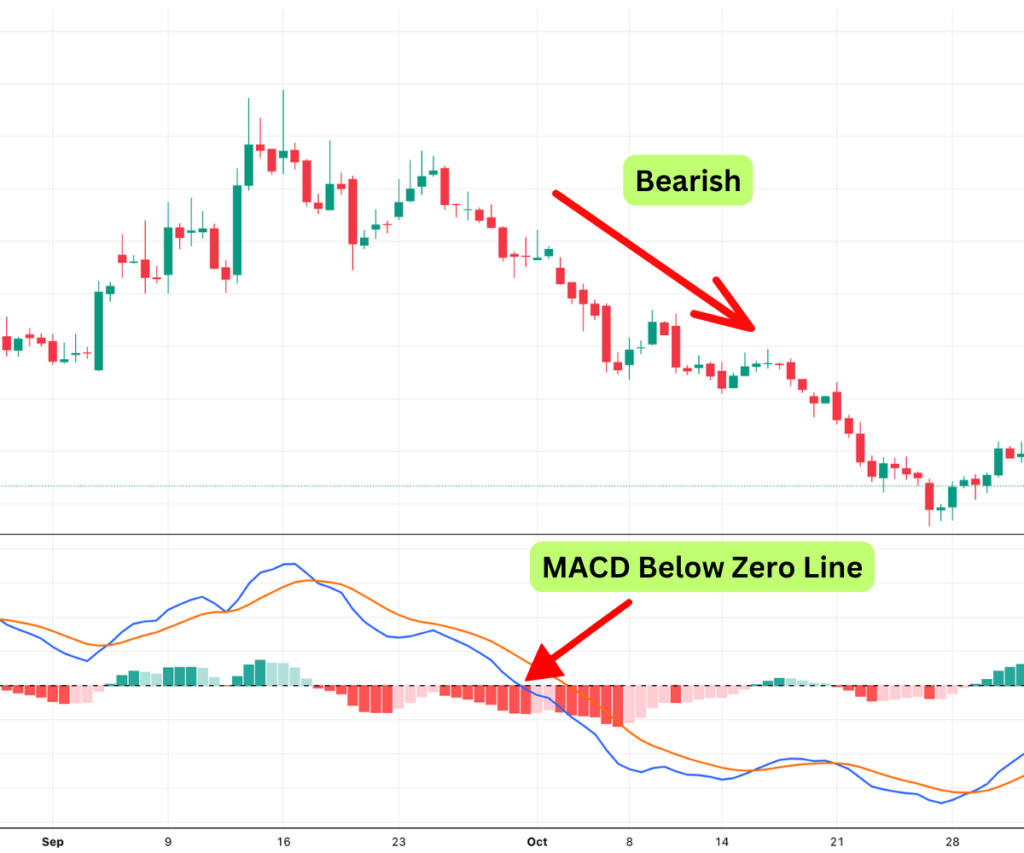
The MACD oscillates above and below a zero line , which serves as a baseline:
- Above Zero : Indicates bullish momentum.
- Below Zero : Indicates bearish momentum.
For example, when the MACD crosses above the zero line, it suggests that the short-term moving average (12-period EMA) is outpacing the long-term moving average (26-period EMA), signaling a potential uptrend.
2. Crossovers
Crossovers are one of the most common ways traders use the MACD indicator :

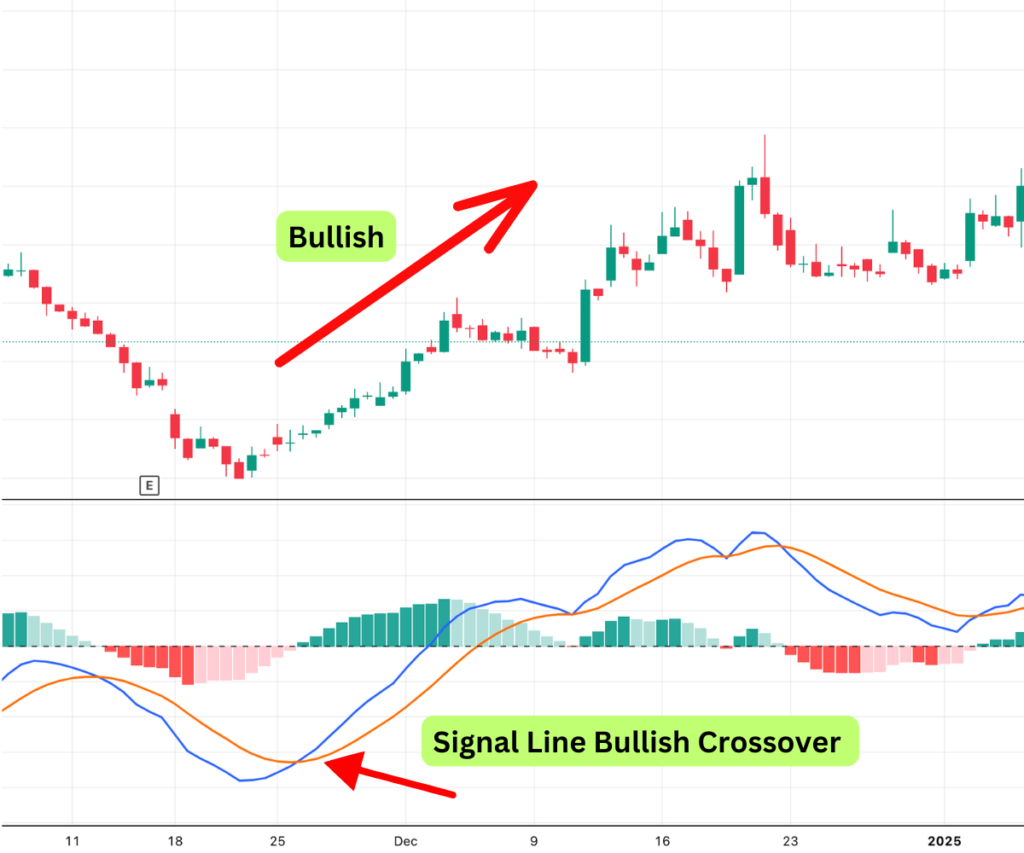
- Signal-Line Crossover : Occurs when the MACD Line crosses above or below the Signal Line.
- Bullish Crossover : Buy signal when the MACD Line crosses above the Signal Line.
- Bearish Crossover : Sell signal when the MACD Line crosses below the Signal Line.
- Zero Crossover : Happens when the MACD Line crosses the zero line.
- Positive to Negative : Bearish signal.
- Negative to Positive : Bullish signal.
3. Histogram
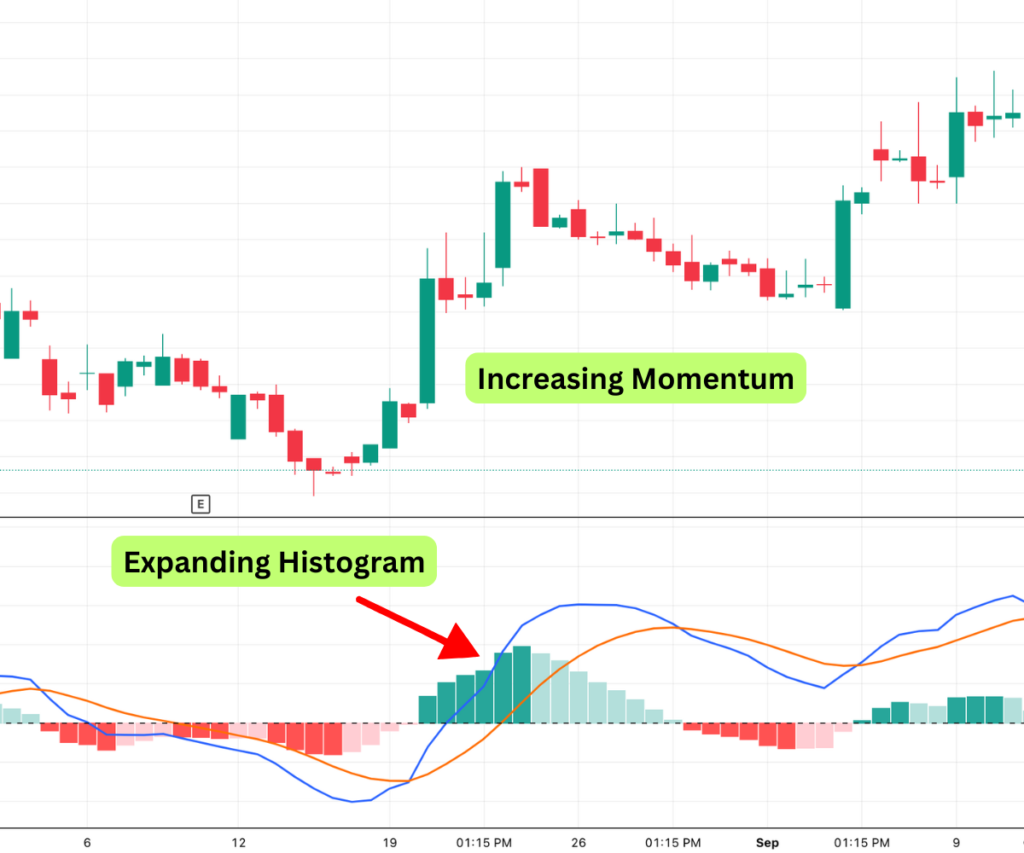
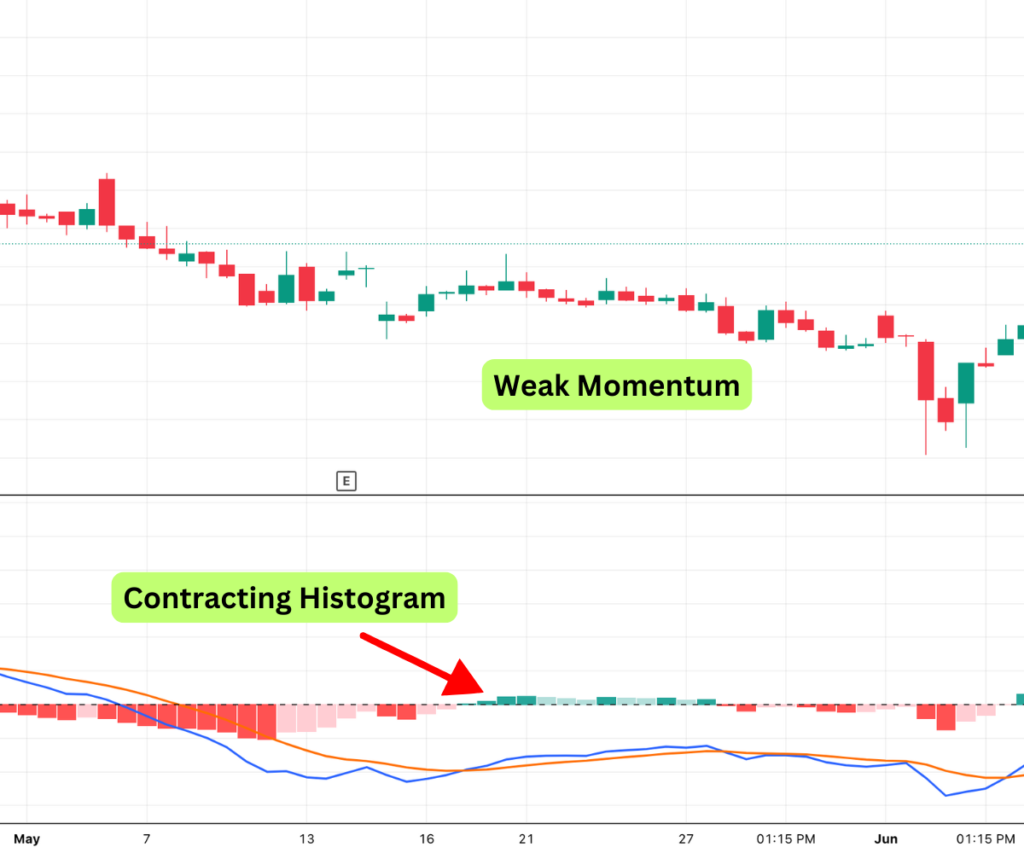
The histogram provides a visual representation of the difference between the MACD Line and the Signal Line:
- Expanding Histogram : Indicates increasing momentum.
- Contracting Histogram : Suggests weakening momentum.
How to Use the MACD Indicator in Trading
Now that you know how to read the MACD indicator , let’s explore how to use it effectively in trading.
1. Signal-Line Crossovers
Signal-line crossovers are one of the simplest ways to trade with the MACD indicator :
- Bullish Crossover : When the MACD Line crosses above the Signal Line, it generates a buy signal.
- Bearish Crossover : When the MACD Line crosses below the Signal Line, it generates a sell signal.
Example :
Imagine you’re analyzing a stock chart, and the MACD Line crosses above the Signal Line after a period of consolidation. This could indicate that the stock is gaining upward momentum, making it a potential buying opportunity.
2. Zero Crossovers
Zero crossovers provide insights into the overall trend direction:
- Positive to Negative : Indicates a shift from bullish to bearish momentum.
- Negative to Positive : Indicates a shift from bearish to bullish momentum.
Pro Tip :
Combine zero crossovers with other indicators like the RSI (Relative Strength Index) to confirm trend reversals.
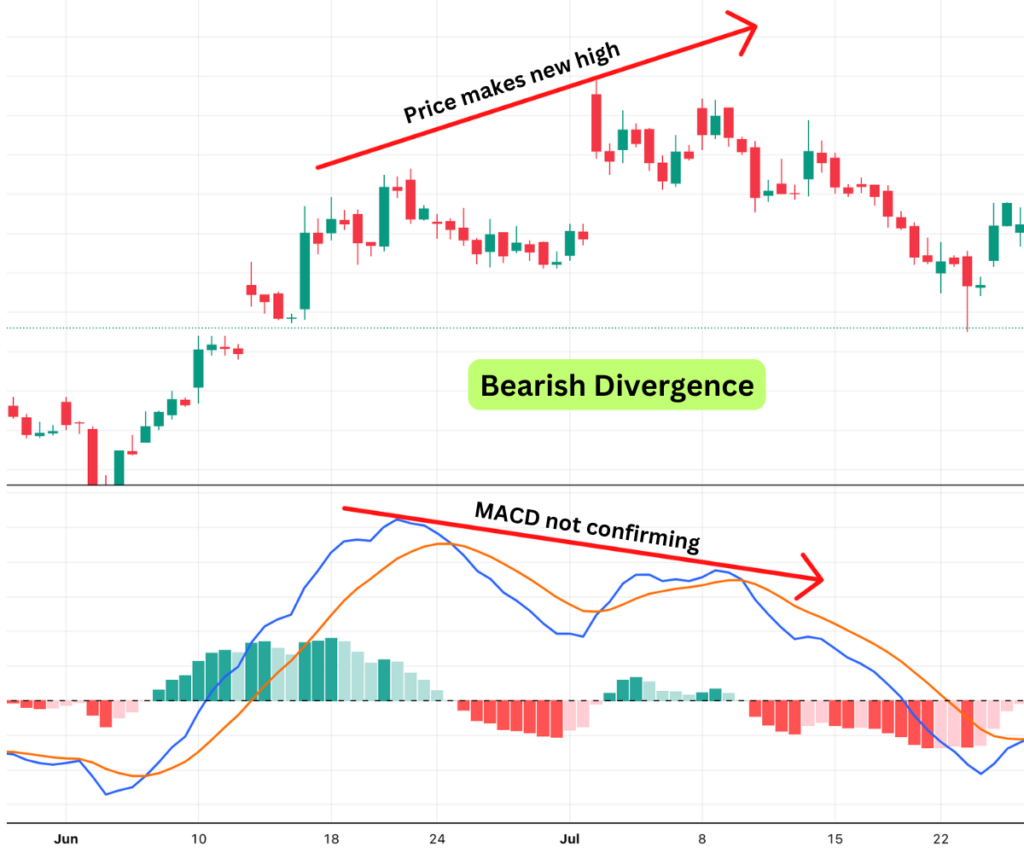
3. Divergences
Divergences occur when the price action and the MACD indicator move in opposite directions:

- Bullish Divergence : Price makes a new low, but the MACD does not confirm with a new low.
- Bearish Divergence : Price makes a new high, but the MACD does not confirm with a new high.
Real-Life Example :
Suppose a stock’s price hits a new low, but the MACD forms a higher low. This bullish divergence suggests that downward momentum is weakening, potentially signaling a reversal.
Best Settings for the MACD Indicator
While the default settings for the MACD indicator are 12, 26, and 9 , many professional traders find these too slow for modern markets. Customizing the settings can help you adapt the MACD to different timeframes and trading styles.
Popular MACD Indicator Settings
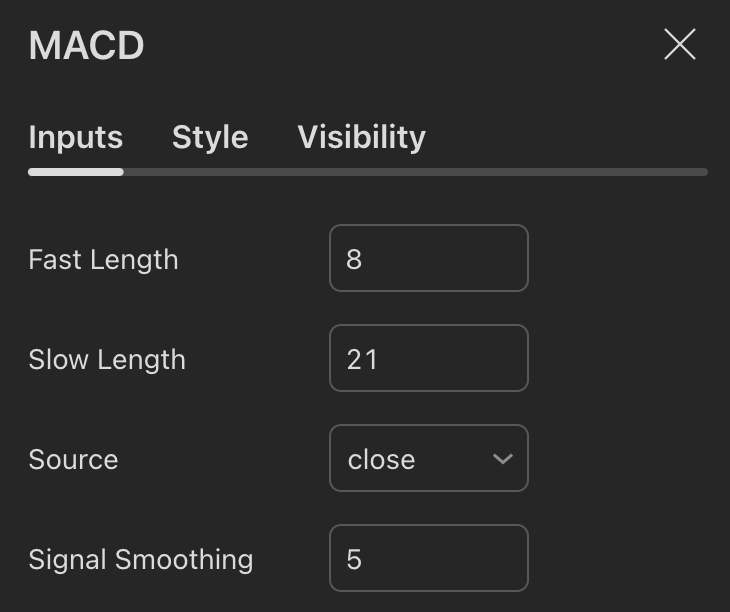
What is a Good MACD Value?
A “good” MACD value depends on your trading style and the settings you use. Here are recommended MACD settings for different types of traders:
- Day Traders : Use faster settings like (5, 13, 5) or (8, 21, 5) to capture quick momentum shifts in intraday charts (e.g., 5-minute or 15-minute timeframes).
- Swing Traders : Stick with the default settings (12, 26, 9) or slightly adjusted settings like (10, 21, 9) for daily or 4-hour charts to identify medium-term trends.
- Long-Term Traders : Use slower settings like (21, 50, 9) or (26, 55, 9) on weekly or monthly charts to filter out noise and focus on major trend reversals.
Regardless of the settings, traders should look for crossovers , zero-line crossings , and divergences as key signals rather than focusing solely on the numeric values.
Testing Custom Settings
Before applying custom settings to live trades, test them on a demo account to evaluate their performance. Look for crossovers that align closely with price reversals.
MACD Indicator Formula
The MACD indicator formula is straightforward but powerful:
MACD Line = 12-Period EMA−26-Period
EMA Signal Line = 9-Period EMA of MACD Line
Histogram = MACD Line−Signal Line
These calculations highlight the relationship between short-term and long-term moving averages, providing insights into market momentum.
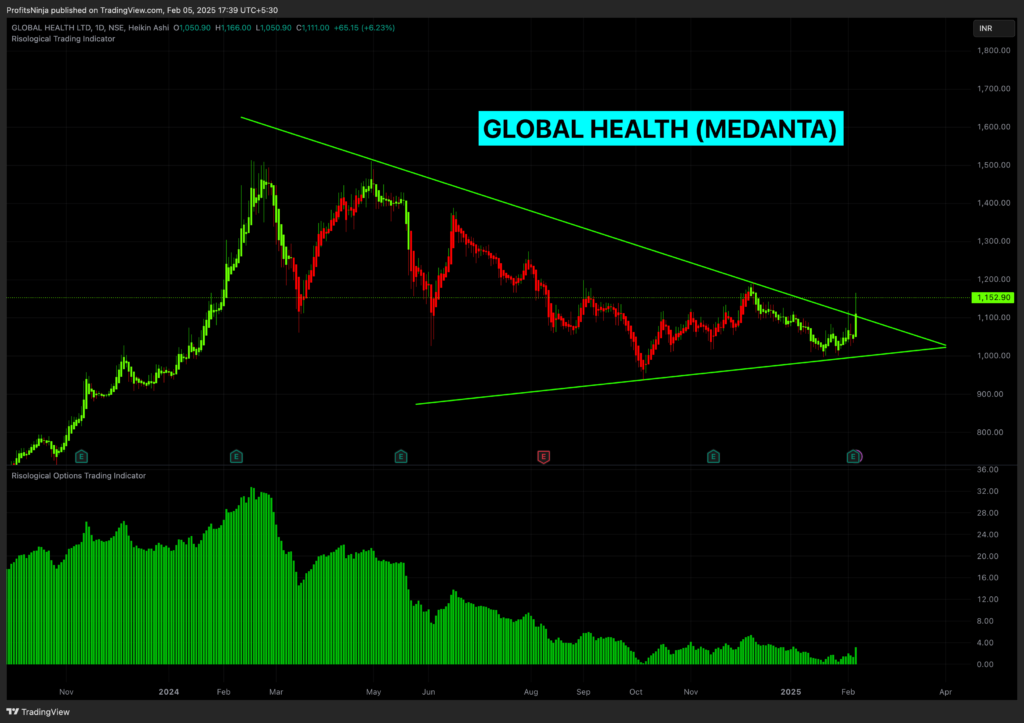
MACD Alternative: Risological Indicator
While the MACD (Moving Average Convergence Divergence) remains one of the most popular momentum indicators, traders are always on the lookout for alternatives that can provide unique insights or address some of the MACD’s limitations.
One such alternative is the Risological Indicator , a lesser-known but powerful tool designed to help traders identify trends, reversals, and market volatility with precision.
What is the Risological Indicator?
The Risological Indicator is a hybrid technical analysis tool that combines elements of trend-following and volatility measurement. Unlike the MACD, which focuses primarily on momentum through moving averages, the Risological Indicator incorporates additional layers of analysis, such as price volatility and risk assessment, to provide a more holistic view of market conditions.
At its core, the Risological Indicator evaluates:
- Price Volatility : Measures how much the price of an asset fluctuates over a given period.
- Trend Strength : Assesses whether the current trend is strong enough to justify entering or exiting a trade.
- Risk Levels : Provides insights into potential risks associated with a trade, helping traders make more informed decisions.
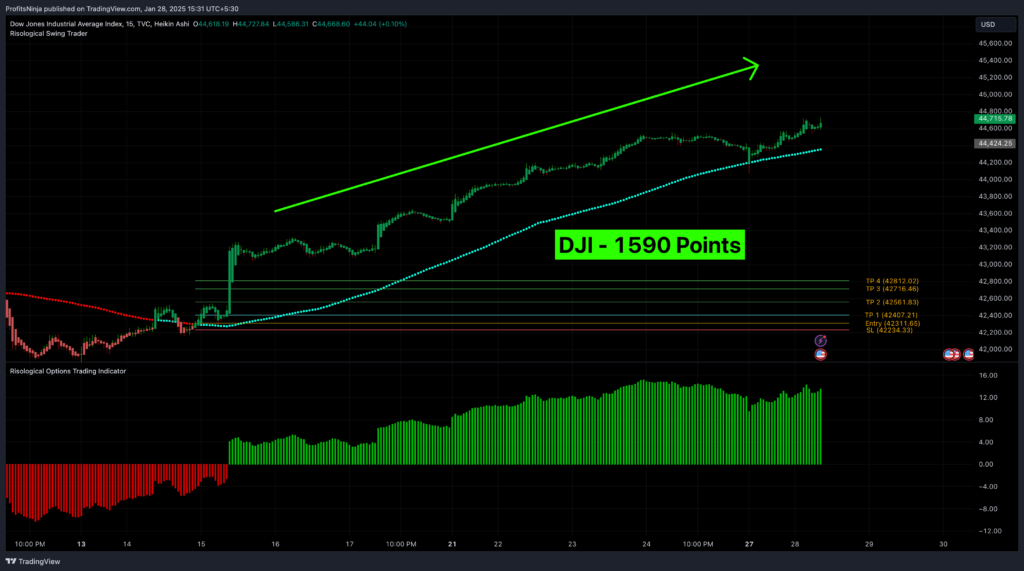
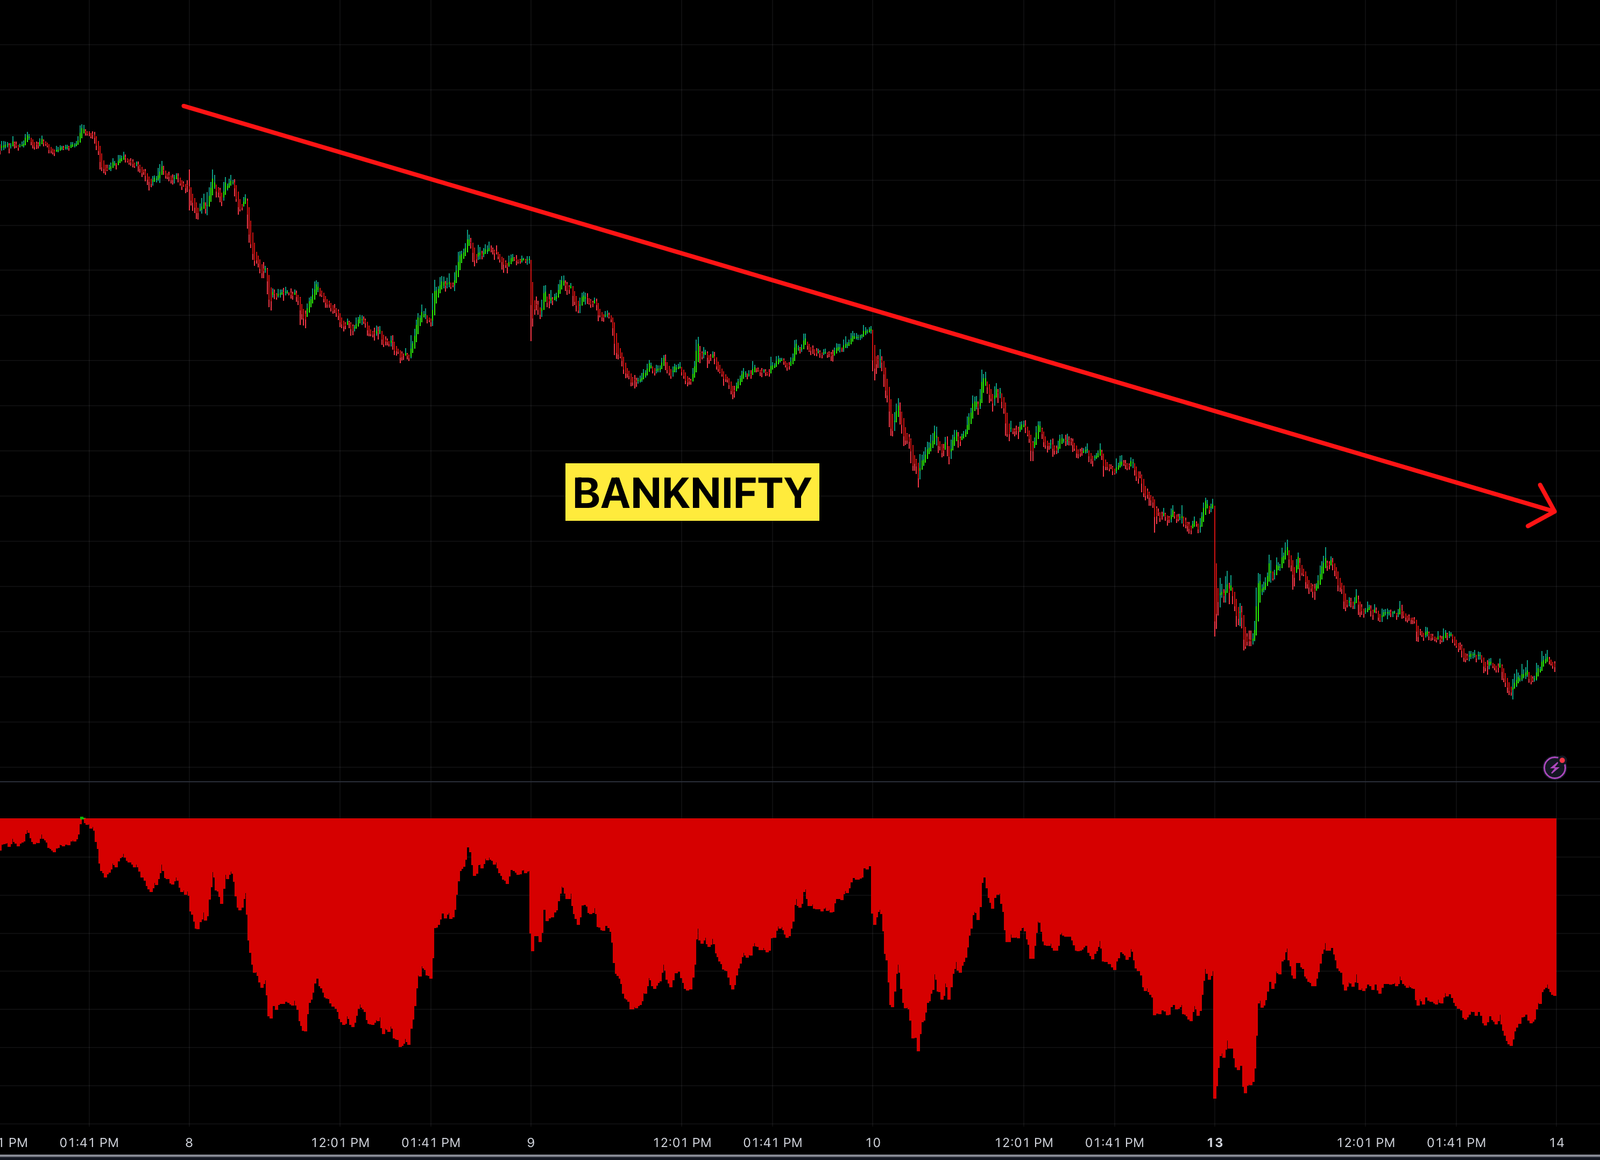
Trades Using Risological Indicators
MACD vs. RSI
| Feature | MACD Indicator | RSI (Relative Strength Index) |
|---|---|---|
| Purpose | Identifies trend momentum, reversals, and the relationship between two EMAs. | Measures overbought/oversold conditions and momentum strength. |
| Range | Unbounded (oscillates above/below zero). | Bounded between 0 and 100. |
| Best For | – Confirming trends – Gauging trend strength – Spotting divergences |
– Timing entries in range-bound markets – Identifying exhaustion points |
| Key Signals | – Signal-line crossovers – Zero-line crossovers – Bullish/bearish divergences |
– Readings above 70 (overbought) – Readings below 30 (oversold) |
| Timeframe Suitability | Works across all timeframes, especially effective in trending markets. | Ideal for short-term trades and consolidating markets. |
| Lagging vs Leading | Primarily lagging, but divergences act as early reversal warnings. | Acts as both: – Lagging (overbought/oversold) – Leading (momentum shifts) |
When to Use MACD vs RSI
MACD Shines When:
- You need to confirm a trend’s strength (e.g., uptrend/downtrend).
- Spotting divergences between price and momentum (e.g., price makes new highs, MACD doesn’t).
- Trading longer timeframes (daily/weekly charts) for trend-following strategies.
RSI Excels When:
- Markets are range-bound (e.g., sideways movement between support/resistance).
- Identifying overextended price moves (e.g., RSI >70 signals potential pullback).
- Executing mean-reversion strategies in volatile assets (stocks, crypto).
Visual Comparison of Signals
| Scenario | MACD Action | RSI Action |
|---|---|---|
| Strong Uptrend | MACD line above zero, rising histogram bars. | RSI hovers near 70 but stays bullish. |
| Bearish Reversal | MACD crosses below signal line + histogram turns negative. | RSI drops below 70, signaling loss of momentum. |
| Range-Bound Market | MACD oscillates near zero with weak crossovers. | RSI bounces between 30-50-70, flagging entries. |
Pro Tips for Combining MACD & RSI
- Divergence Combo: Use MACD divergences with RSI extremes for high-confidence reversals.
- Example: Bullish MACD divergence + RSI <30 = Strong buy signal.
- Trend Confirmation: MACD above zero + RSI >50 = Validates bullish trend.
- Avoid False Signals: Ignore MACD crossovers if RSI is neutral (40-60).
Limitations of the MACD Indicator
While the MACD indicator is a powerful tool, it’s not without limitations:
- False Signals : The MACD can generate false positives, especially during sideways or choppy markets.
- Lagging Nature : As a lagging indicator, the MACD may provide delayed signals, causing late entries or exits.
- Overbought/Oversold Levels : Unlike the RSI, the MACD doesn’t have predefined overbought or oversold levels.
To mitigate these limitations, traders often combine the MACD with other indicators like the RSI or ADX for confirmation.
Frequently Asked Questions (FAQs)
1. What is the Full Form of MACD?
The full form of MACD is Moving Average Convergence Divergence .
2. How to Trade with the MACD Indicator?
To trade with this indicator, focus on signal-line crossovers, zero crossovers, and divergences. Combine these signals with other indicators for additional confirmations.
3. What Are the Best Settings for the MACD Indicator?
The best settings depend on your trading style. Popular alternatives to the default settings include 8, 21, 5 for short-term trading and 3, 10, 16 for intraday trading.
4. Which One is Better, MACD or RSI?
Both the MACD and RSI are powerful indicators, but they serve different purposes. The MACD is ideal for identifying trends and momentum shifts, while the RSI excels at spotting overbought or oversold conditions.
For trend-following strategies, the MACD is often preferred, whereas the RSI works better for mean-reversion trades. Combining both can provide a more comprehensive analysis.
5. How to Use MACD to Buy or Sell?
To use the MACD indicator for trading:
Buy Signal : When the MACD Line crosses above the Signal Line (bullish crossover).
Sell Signal : When the MACD Line crosses below the Signal Line (bearish crossover). Additionally, watch for zero crossovers and divergences to confirm trends.
6. Which Time Frame is Best for MACD?
The MACD works well across various timeframes, but its effectiveness depends on your trading style:
Daily Charts : Ideal for swing traders.
15-Minute or Hourly Charts : Suitable for day traders. For long-term trends, weekly charts can also provide reliable signals.
7. Is MACD Good for Day Trading?
Yes, the MACD can be effective for day trading when used with shorter timeframes (e.g., 5-minute or 15-minute charts). However, it’s essential to combine it with other indicators like volume or support/resistance levels to filter out false signals in volatile markets.
8. Is MACD Profitable?
The MACD can be profitable when used correctly. Its ability to identify trends and momentum shifts makes it a valuable tool for traders. However, profitability depends on proper risk management, combining it with other indicators, and avoiding over-reliance on lagging signals.
9. What Are the Limitations of the MACD Indicator?
The MACD has some limitations:
It can generate false signals in choppy or sideways markets.
As a lagging indicator , it may provide delayed entry/exit points.
It doesn’t have predefined overbought/oversold levels like the RSI. To mitigate these, traders often use additional filters or combine it with other tools.
10. How Do You Identify Divergence in MACD?
Divergence occurs when the price and MACD move in opposite directions:
Bullish Divergence : Price makes a lower low, but MACD forms a higher low.
Bearish Divergence : Price makes a higher high, but MACD forms a lower high. This signals potential reversals and helps traders anticipate changes in momentum.
11. Can MACD Be Used Alone for Trading?
While the MACD is a powerful standalone tool, it’s best used in combination with other indicators like RSI, moving averages, or support/resistance levels. This helps confirm signals and reduce the risk of false positives, especially in volatile markets.
Conclusion
The MACD indicator is a versatile and reliable tool for traders looking to identify trends, reversals, and potential trade opportunities. By understanding its components, customizing its settings, and combining it with other indicators, you can develop a robust trading strategy.
Remember, no single indicator is foolproof. Always practice on a demo account before applying any strategy to live trading. With patience and discipline, the MACD indicator can become an invaluable part of your trading toolkit.
Also, if you’re looking to diversify your trading toolkit and explore new ways to analyze the markets, the Risological Indicator is worth considering.
Good luck!