
Introduction
Hey there, future pro trader!
If you’ve ever wondered how some traders seem to know exactly when to buy low and sell high, chances are they’re using tools like the RSI indicator—or even better, advanced tools like those offered by Risological.com
RSI, or Relative Strength Index , is one of the most popular tools in a trader’s toolbox—and for good reason. It helps you spot when a stock (or any asset) is overbought (too expensive) or oversold (a bargain).
But here’s the kicker: RSI isn’t just about buying low and selling high. It can also help you identify trends, reversals, and even confirm whether a trade is worth taking.
In this guide, I’ll break down everything you need to know about the RSI indicator in simple terms. By the end, you’ll feel confident enough to start using it in your own trading.
Oh, and if you want to take your RSI skills to the next level, don’t forget to check out my eBook, “RSI Indicator for Beginners: Everything You Need to Know,” available for just $2.99. It’s packed with advanced strategies, real-world examples, and step-by-step instructions.
Ready? Let’s get started!
What Is the RSI Indicator?
So, what exactly is this magical tool called RSI?
RSI stands for Relative Strength Index , and it’s a momentum indicator that measures how fast prices are moving up or down.
Think of it like a speedometer for stocks. When the needle goes too high, it means the stock might be overbought (like paying too much for a toy at a store). When the needle drops too low, it could mean the stock is oversold (like finding that same toy on sale).
The RSI ranges from 0 to 100, and here’s the cool part:
- Above 70 : The stock is overbought (potential sell signal).
- Below 30 : The stock is oversold (potential buy signal).
- Between 30 and 70 : The stock is in a neutral zone (no clear trend).
It’s like a traffic light for traders: red (overbought), green (oversold).
How Does the RSI Work?
Now, let’s talk about how this thing actually works. Don’t worry—I won’t bore you with complicated math. Instead, I’ll explain it like you’re sitting across the table from me. (which you are)
Here’s the gist:
- The RSI looks at the average gains and losses of a stock over a specific period (usually 14 days).
- It then compares those gains and losses to figure out the stock’s momentum.
- Finally, it spits out a number between 0 and 100, which tells you whether the stock is overbought, oversold, or somewhere in between.
For example, if a stock has been climbing steadily for weeks, the RSI might show a reading above 70, signaling that it’s overbought.
On the flip side, if the stock has been dropping like a rock, the RSI might dip below 30, signaling that it’s oversold.
Want to dig deeper into the formula? Grab my eBook—it breaks it all down step by step without making your brain hurt.
Reading the RSI Indicator
Okay, now that you know what RSI is and how it works, let’s talk about how to read it. This is where things get fun because you’ll start seeing patterns that can help you make smarter trades.
Here’s what to look for:
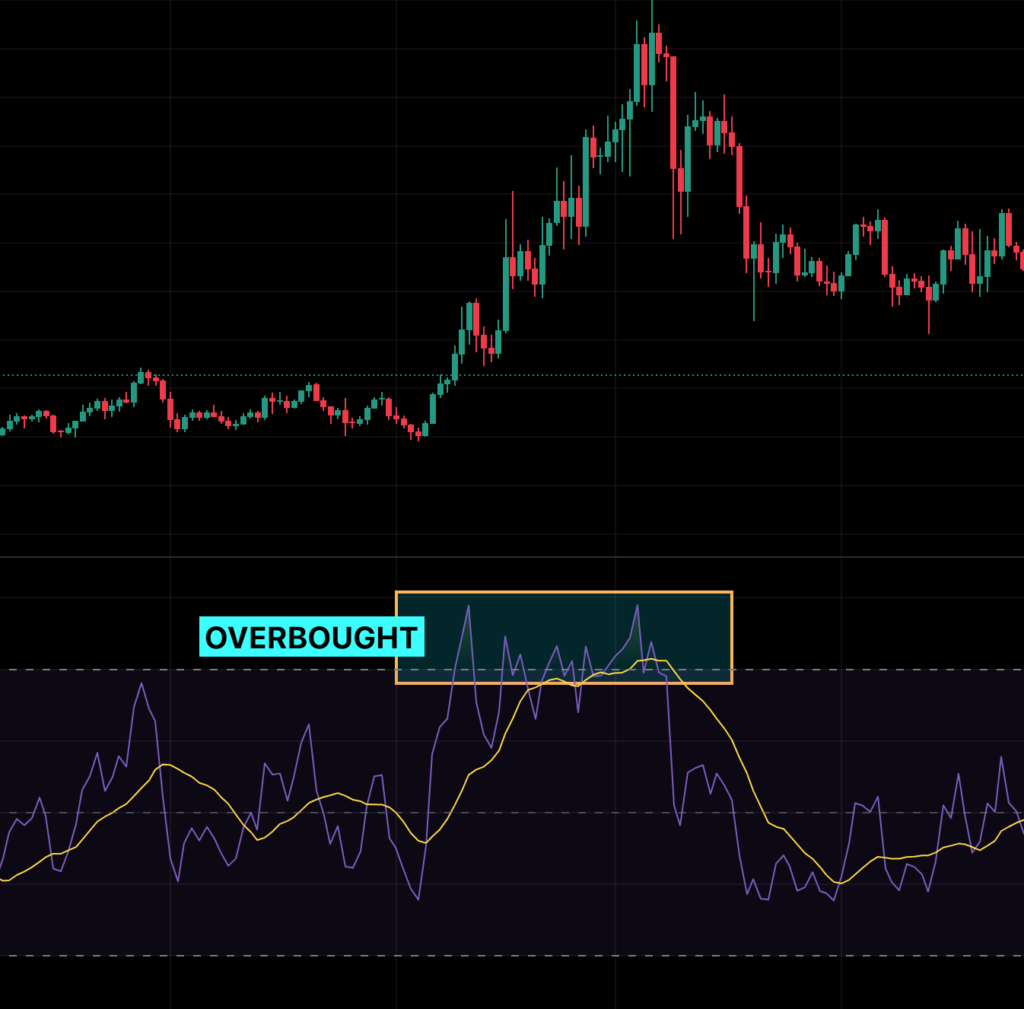
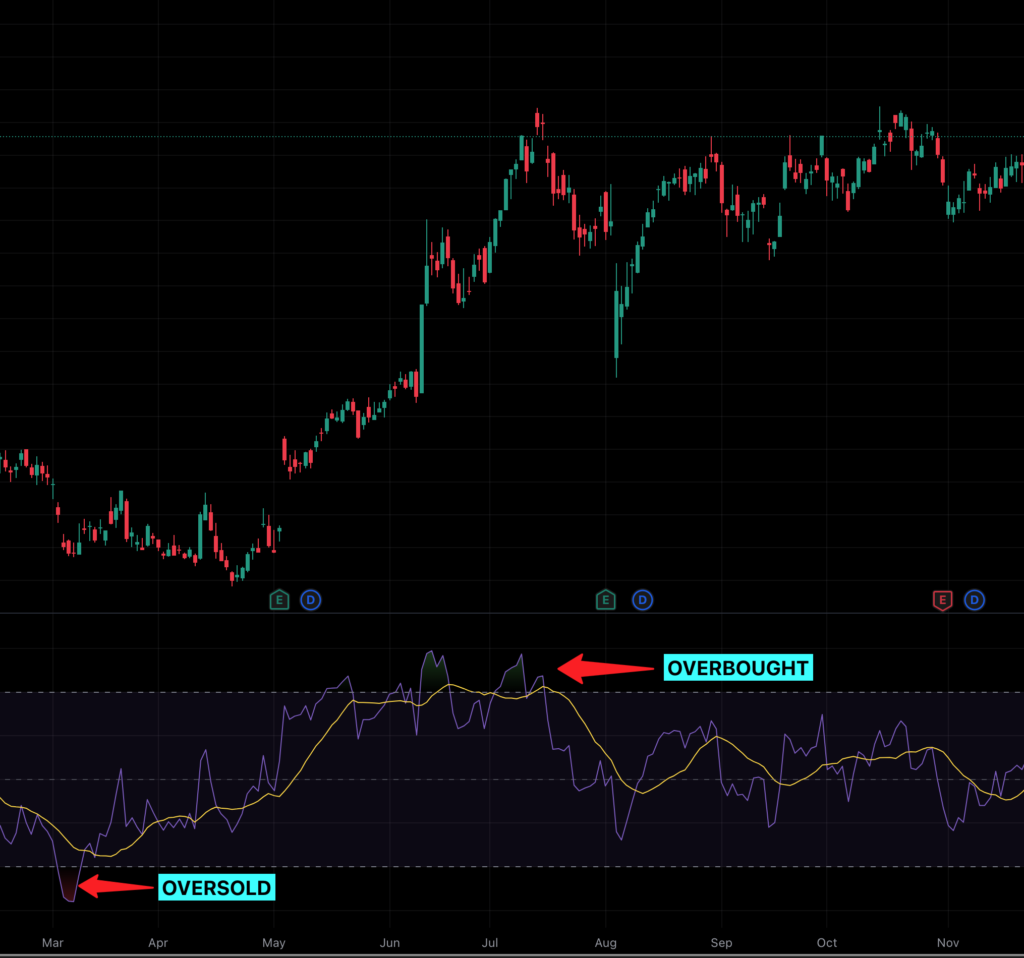
- Overbought Zone (>70) : When the RSI climbs above 70, it’s like a warning sign that says, “Hey, this stock might be getting too expensive!” It doesn’t always mean the price will drop, but it’s a good time to think about selling or avoiding new buys.
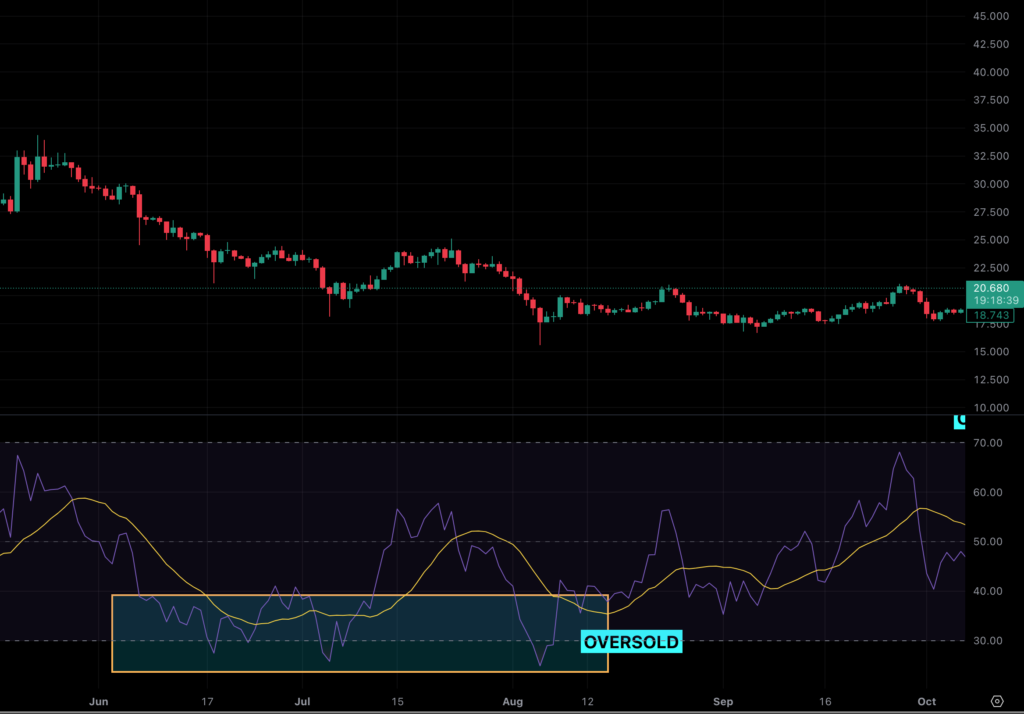
- Oversold Zone (<30) : When the RSI drops below 30, it’s like a bargain alert. The stock might be undervalued, and it could be a great time to buy—especially if other indicators agree.
- Neutral Zone (30–70) : If the RSI is hanging out between 30 and 70, it means the stock isn’t showing any extreme momentum. In this case, you’ll need to rely on other tools (like trendlines or moving averages) to make decisions.
Let me give you a quick example:
Imagine you’re looking at Apple stock, and its RSI shoots up to 85. That’s way above 70, so you might think, “Hmm, maybe it’s time to take profits.”
On the other hand, if the RSI drops to 20, you might say, “Wow, this could be a great buying opportunity!”
Best RSI Settings for Different Traders
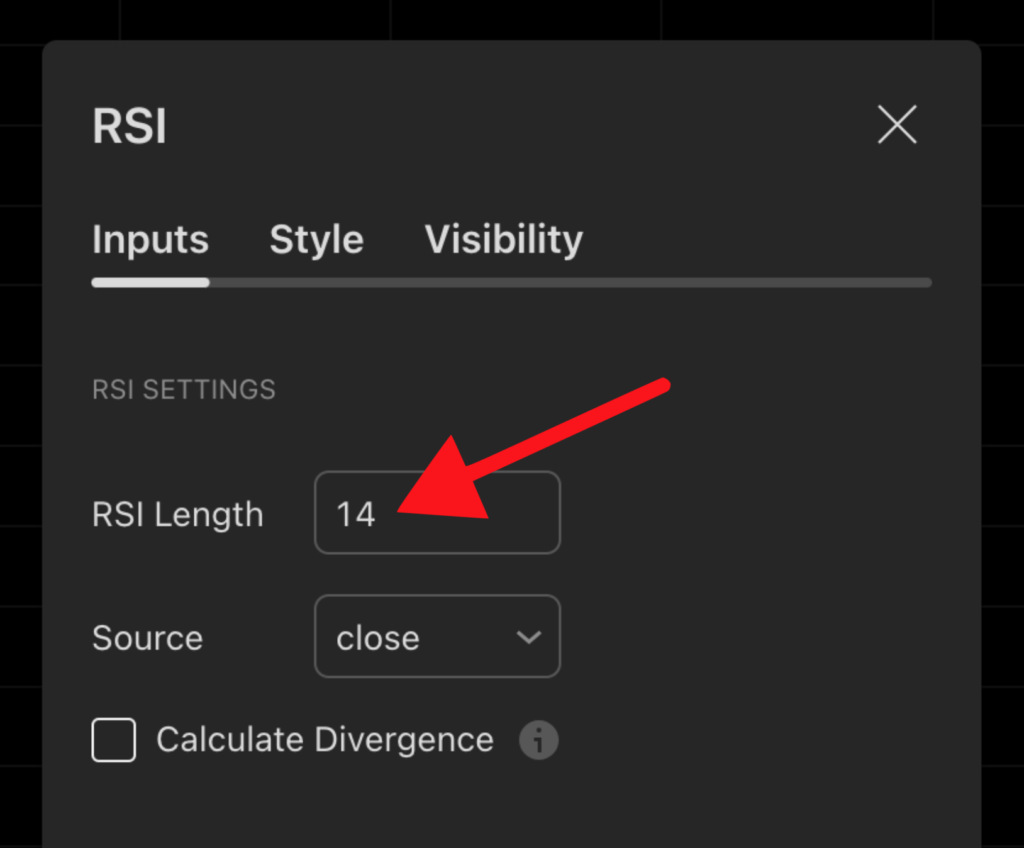
Now, here’s where things get interesting. While the default setting for RSI is 14 periods (usually 14 days), that doesn’t mean it’s perfect for everyone. Different traders use different settings depending on their style.
Here’s a quick breakdown:
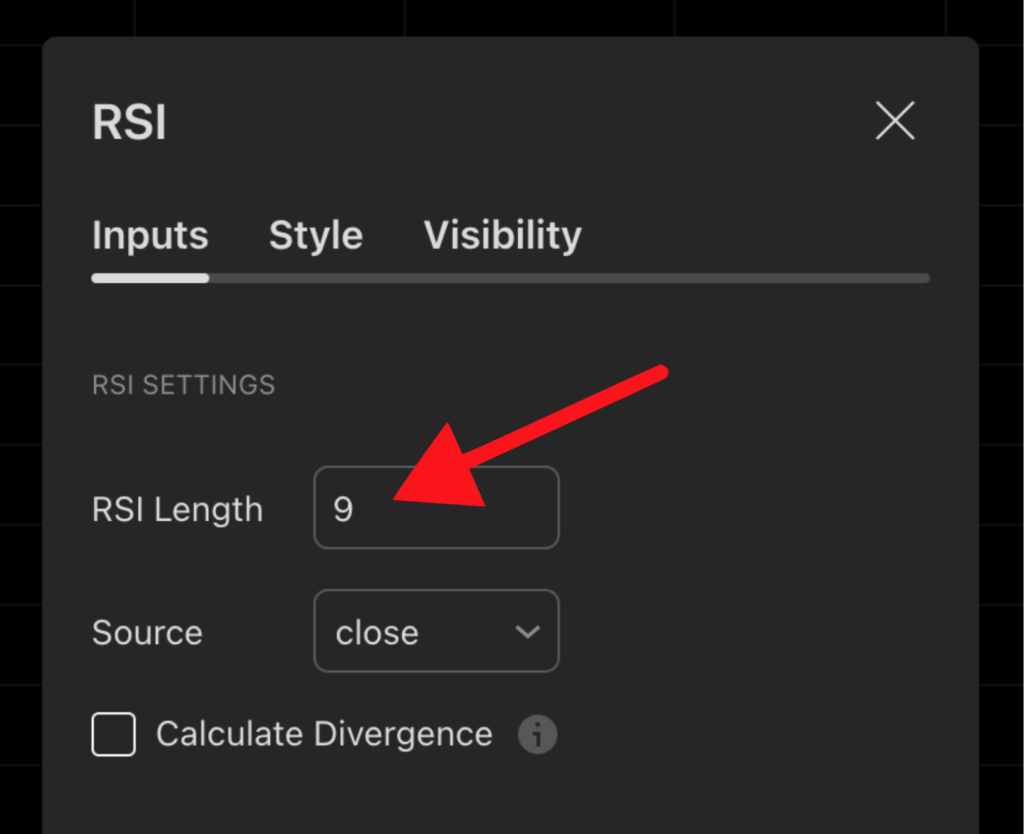
Day Traders : These folks love fast action, so they often use shorter periods like 9 or 10. This makes the RSI more sensitive to quick price moves.
Swing Traders : They hold trades for a few days to weeks, so the default 14-period setting works great.
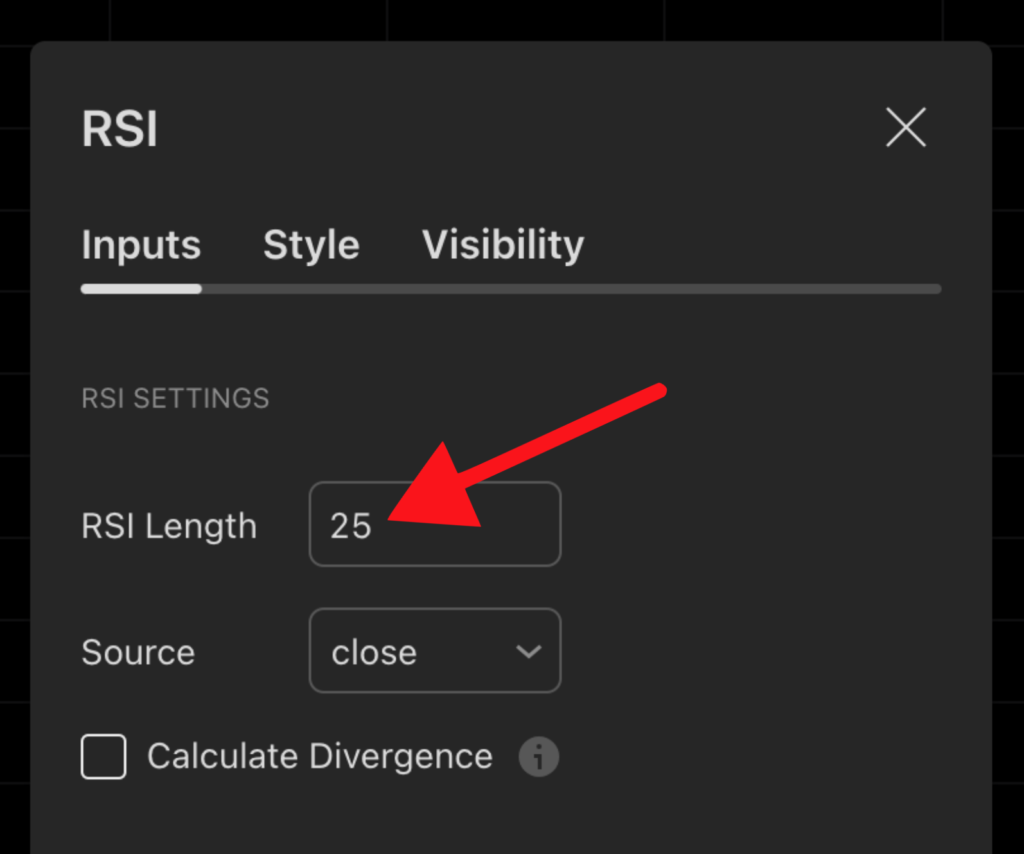
Long-Term Investors : If you’re in it for the long haul, you might bump the RSI up to 20 or 25 periods to smooth out short-term noise.
Pro Tip: Start with the default 14-period setting and tweak it based on your trading style. And if you want to master custom settings, my eBook has a whole section dedicated to this topic.
RSI Buy and Sell Signals
Alright, let’s get to the good stuff: how to use the RSI indicator to spot buy and sell signals.
Here’s the simplest way to do it:
- Buy Signal : Look for RSI readings below 30. This suggests the stock is oversold and could bounce back.
- Sell Signal : Look for RSI readings above 70. This suggests the stock is overbought and could pull back.
But wait—there’s more!
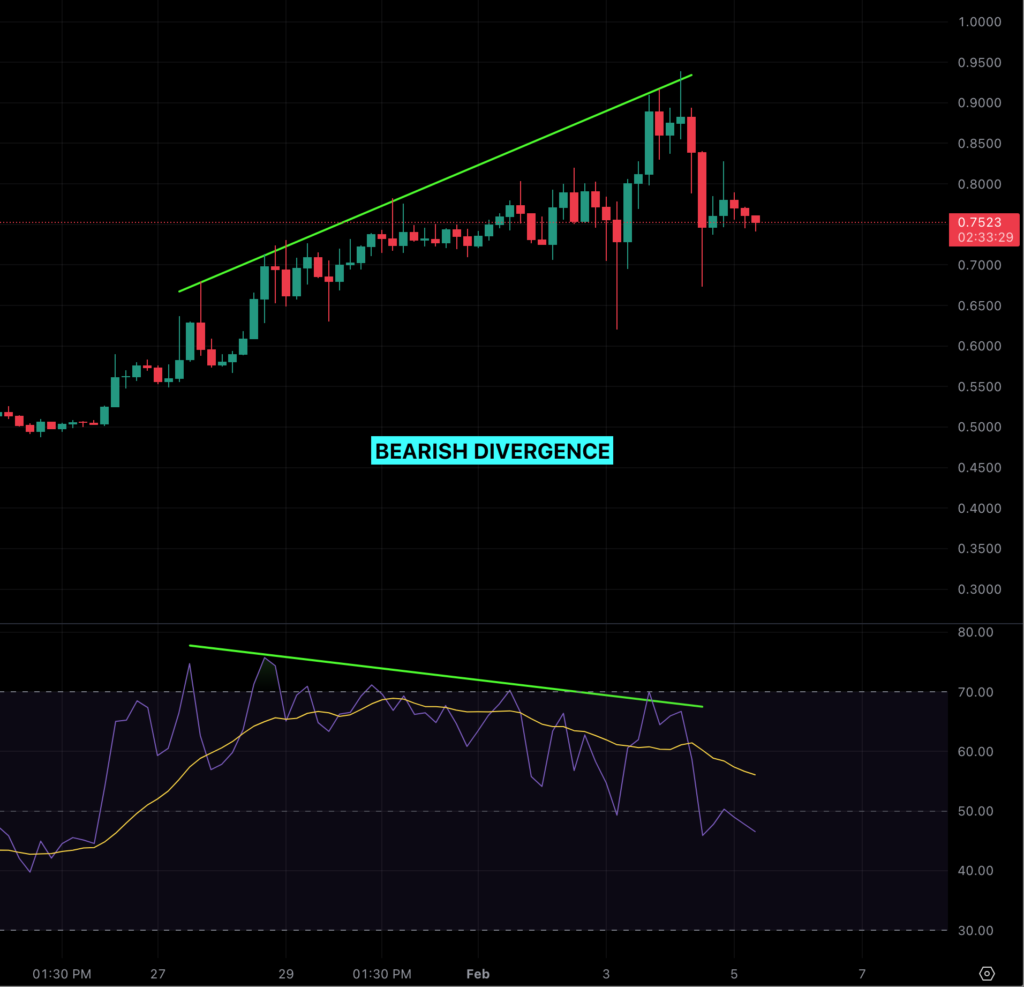
One of the coolest things about RSI is something called divergence . This happens when the stock price and the RSI move in opposite directions.
For example:
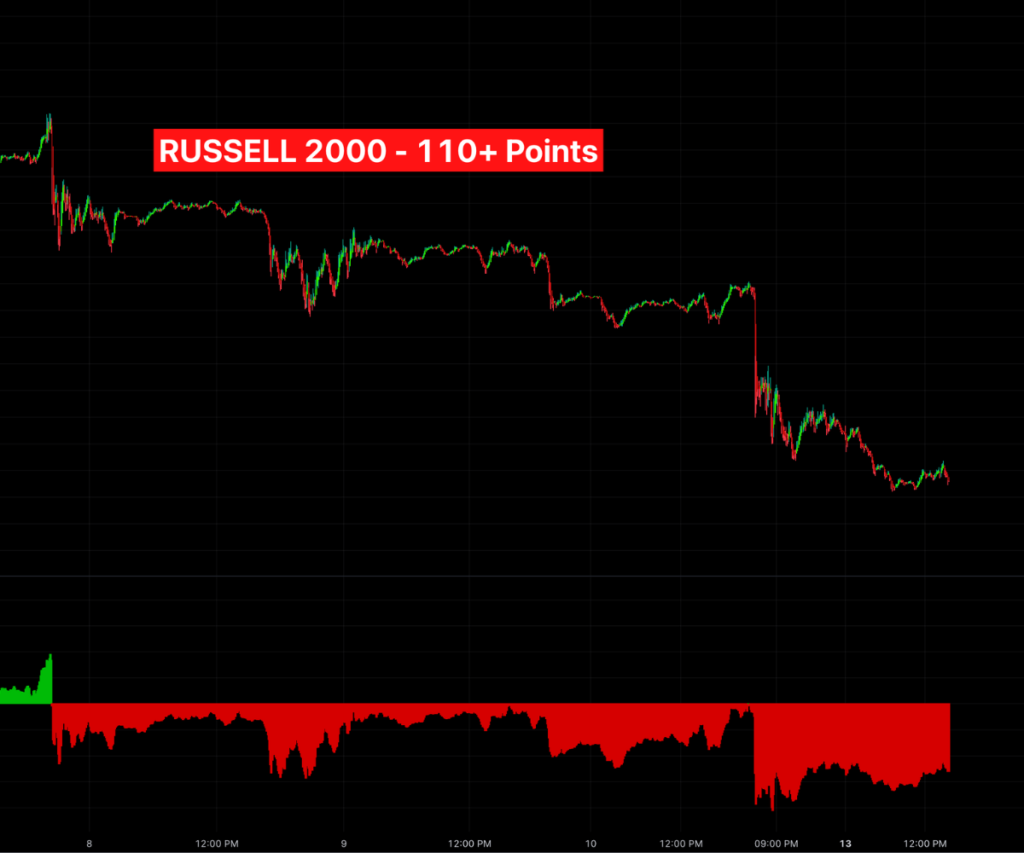
- If the stock is making higher highs but the RSI is making lower highs, it could signal a reversal. You can see below, the price is rising, while the RSI is dropping. This is called “Bearish divergence.”
- Result? You can see the price falls.
Divergence is a powerful tool, but it takes practice to spot.
Advanced RSI Strategies
Alright, now that you’ve got the basics down, let’s talk about some advanced strategies. These are the tricks that separate the pros from the amateurs.
Don’t worry—I’ll keep it simple so you can start using these techniques right away.
- RSI Divergence :
Remember how I mentioned divergence earlier? Let’s dive a little deeper. There are two types:- Regular Divergence : This happens when the price makes a new high (or low), but the RSI doesn’t confirm it. For example, if the stock hits a new high but the RSI is lower than before, it could mean the uptrend is losing steam.Hidden Divergence : This is a bit trickier. It happens when the price makes a higher low (in an uptrend) or a lower high (in a downtrend), but the RSI shows the opposite. Hidden divergence often signals a continuation of the current trend.
- RSI Swing Rejections :
This strategy helps you spot trend continuations. Here’s how it works:- In an uptrend, look for the RSI to dip below 30 and then quickly bounce back above it. This could signal that the uptrend is resuming.In a downtrend, look for the RSI to spike above 70 and then drop back below it. This could signal that the downtrend is continuing.
Swing rejections are like little “confirmation signals” that the trend is still strong.
Limitations of the RSI Indicator
Now, here’s the reality check: as awesome as RSI is, it’s not perfect. Like any tool, it has its limitations. Here are the big ones you need to watch out for:
- False Signals in Strong Trends :
If a stock is in a strong uptrend or downtrend, the RSI can stay overbought or oversold for a long time. For example, during a bull market, the RSI might stay above 70 for weeks—even though the stock keeps climbing. - Lagging Nature :
RSI is a lagging indicator, which means it reacts to price movements after they happen. By the time the RSI gives you a signal, the move might already be underway. - Overreliance on Overbought/Oversold Levels :
Just because the RSI hits 80 doesn’t mean the stock will crash. Similarly, an RSI of 20 doesn’t guarantee a rebound. You need to look at the bigger picture—things like trends, volume, and other indicators.
Pro Tip: Always use RSI alongside other tools, like moving averages or MACD, to confirm your trades.
Common Mistakes to Avoid
Let’s talk about some rookie mistakes that can cost you money. Avoid these, and you’ll already be ahead of most traders:
- Over-relying on Overbought/Oversold Levels :
Don’t blindly buy just because the RSI is below 30 or sell because it’s above 70. Context matters! Look at the overall trend and other indicators. - Ignoring the Bigger Picture :
RSI works best when you combine it with price action, volume, and other tools. Trading with RSI alone is like driving with one eye closed—you’re missing half the picture. - Using RSI in Isolation :
Always confirm your RSI signals with other indicators. For example, if the RSI says “buy,” but the moving averages are bearish, you might want to hold off.
Remember: Trading isn’t about perfection—it’s about making smart, informed decisions.
RSI Indicator Alternative
Spotting divergence can be tricky, but tools like the Risological Trading Indicators make it easier by highlighting discrepancies between price and momentum.


FAQs About the RSI Indicator
Got questions? I’ve got answers. Here are some of the most common questions I hear about RSI:
- What is a good RSI number to use?
The default 14-period setting works for most traders. If you’re a day trader, try shorter periods like 9 or 10. For long-term investing, go with 20 or 25. - How accurate is the RSI indicator?
RSI is reliable when used correctly—but it’s not foolproof. Combine it with other tools to improve accuracy. - How do I set up the RSI indicator on my platform?
Most platforms (like TradingView, MetaTrader, or Thinkorswim) have RSI built in. Just search for “RSI” in the indicators menu, and it’ll pop up. Adjust the settings to 14 periods (or your preferred number). - What’s the difference between RSI and MACD?
Great question! RSI measures momentum, while MACD (Moving Average Convergence Divergence) focuses on trend strength. Use them together for a more complete picture.
Conclusion
Congratulations—you’ve just unlocked the secrets of the RSI indicator!
Now you know how to spot overbought and oversold levels, identify buy/sell signals, and avoid common pitfalls.
But here’s the thing: mastering RSI takes practice.
Start by applying what you’ve learned today on a demo account or with small trades. And if you’re ready to take your skills to the next level, don’t forget to grab my eBook, “RSI Indicator for Beginners: Everything You Need to Know.”
For just $2.99, you’ll get advanced strategies, real-world examples, and step-by-step guides to help you trade like a pro.
One last tip: Trading is a journey, not a destination. Stay curious, keep learning, and never stop improving.
Happy trading!