Looking for the best indicator for option trading? Samose ki tarah crisp signals, aur chai ki tarah kadak accuracy!
Toh iss post ko araaaaam se read karo!
Table of Contents
IMPORTANT Introduction
According to SEBI, over 90% of traders in the F&O segment lose money.
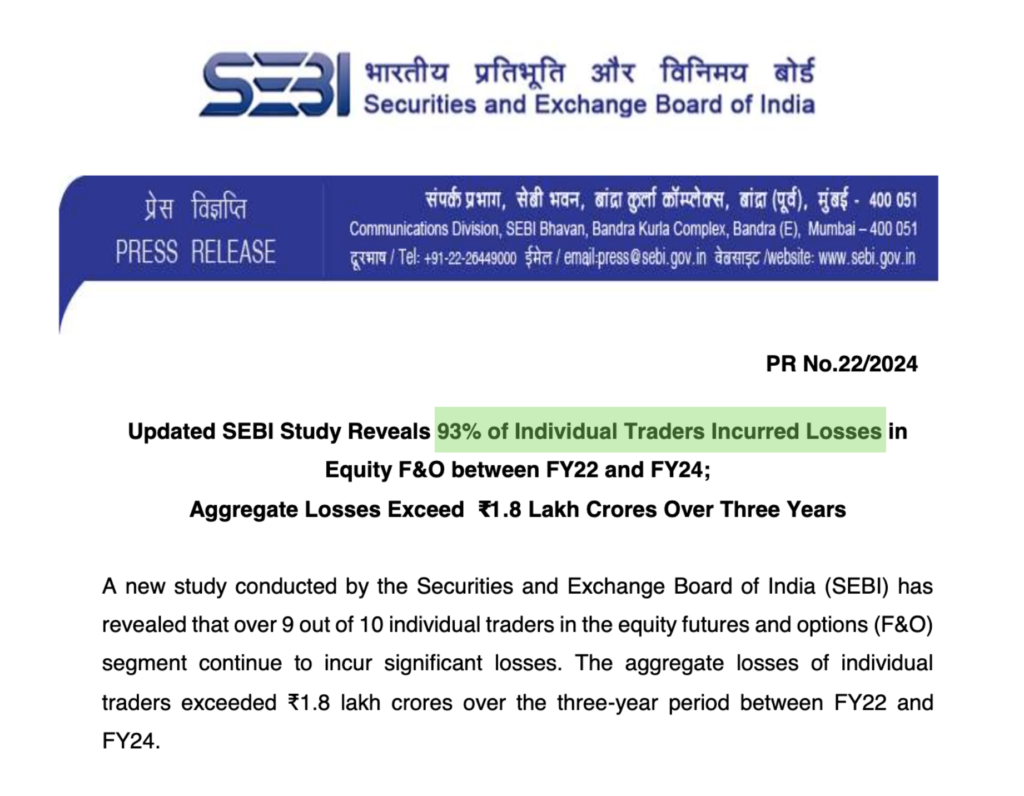
Bhai saab! Let that sink in for a moment.
.
.
If you’re trading options, you’re essentially stepping into a battlefield where the odds are stacked against you.
But here’s the kicker: it’s not because the market is rigged or because you don’t have the right tools.
It’s because most traders focus on the wrong things—chasing quick profits, wanting to become crorepatis in 1 month, ignoring risk management, and relying on indicators like they’re magic pills.
Let me tell you something no one else will: Indicators alone won’t make you profitable.
But when combined with discipline, risk management, and a deep understanding of the market, they can be your secret weapon.
This post isn’t just about listing the best indicators for option trading; it’s about helping you understand how to use them effectively to become part of the profitable 10%.
We’ll explore the best indicators for popular indices like Nifty, BankNifty, and DJI, uncover hidden aspects of options trading, and reveal why most traders fail.
By the end, you’ll have a clear roadmap to transform your trading game.
Let’s dive in. Shall we?
Best Indicator for Option Trading
Indicators are like the dashboard of your car—they tell you when to speed up, slow down, or take a detour. But just like you wouldn’t rely solely on your speedometer to drive, you shouldn’t rely on a single indicator to trade.
Here’s a curated list of the best indicators for option trading, along with their strengths, weaknesses, and unique use cases:
1. Risological Options Trading Indicator
What It Does: Analyzes price action and volatility to capture significant market movements across any chart.
How To Take Trades :
- Purchase the indicator from Risological.com
- Apply to your chart in TradingView account
- Bullish (BUY CE): When Risological is in GREEN
- Bearish (BUY PE): When Risological is in RED
Key Insight: If this indicator signals a confirmed trend breakout, traders can consider initiating options positions to ride the momentum. However, false breakouts can occur, so combining it with other indicators like ADX can improve accuracy.
Best Used For:
- Identifying high-probability breakouts and reversals.
- Suitable for Nifty, BankNifty, DJI, Russell 2000 and all major indexes, worldwide.
- Recommended timeframe: 5 minute
2. Risological Swing Trading Indicator

What It Does: Tailored for swing traders, this indicator helps capture medium-term price fluctuations.
How To Take Trades :
- Purchase the indicator from Risological.com
- Apply to your chart in TradingView account
- Bullish (BUY CE): When price closes above the Risological dotted trendline, entry, targets and SL marked for you on your chart. Big timesaver!
- Bearish (BUY PE): When price closes below the Risological dotted trendline.
Key Insight: If the indicator signals an uptrend but RSI is overbought, traders may wait for a slight pullback before entering trades. This improves risk management and prevents premature entries.
Best Used For:
- Swing traders looking for clear entry and exit signals.
- Capturing price momentum in both trending and range-bound markets.
- Recommended timeframe: 15 minute+ for better accuracy
3. Exponential Moving Average (EMA)
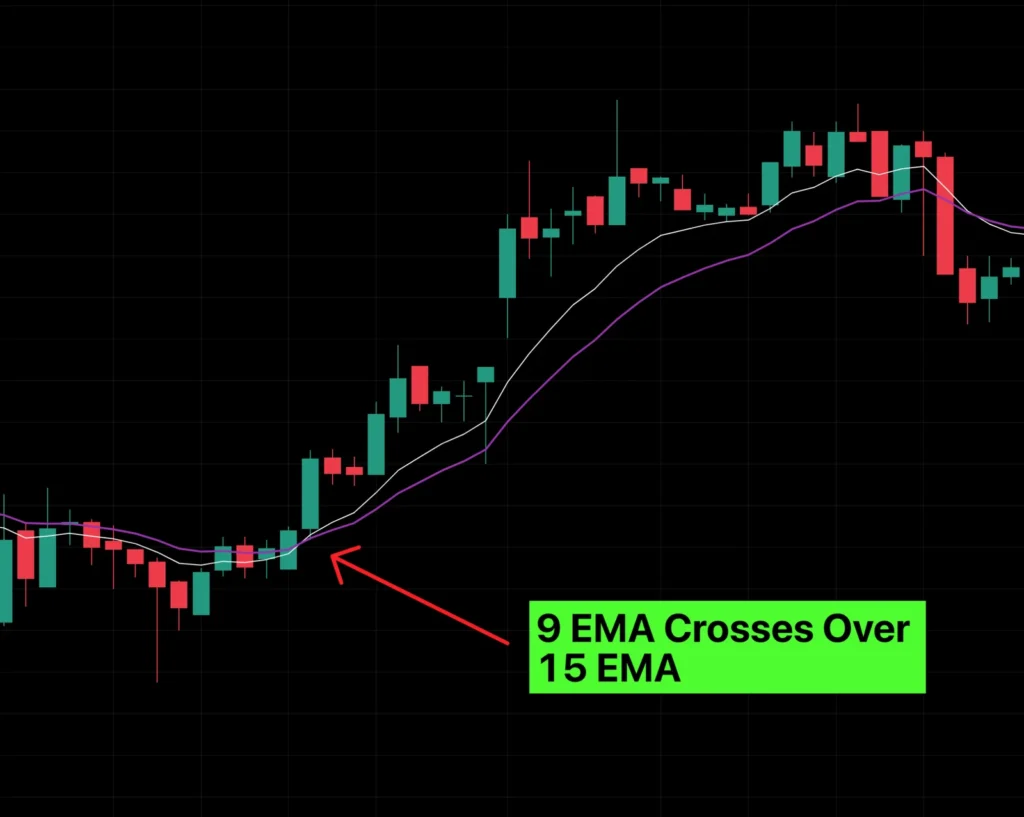
What It Does: A dynamic moving average that places more weight on recent prices, making it more responsive to trend shifts.
How To Take Trades :
- Apply single or multiple EMA indicator(s) to your chart
- You can use 50 EMA if you using only one EMA
- Use 9 EMA and 15 EMA if you are using two EMAs
- Take trades based on bullish and bearish crossovers
Key Insight: If the price crosses above the 50-period EMA with rising volume, it may signal a strong bullish trend. Conversely, a cross below the EMA could indicate trend weakness, suggesting exit or caution.
Best Used For:
- Trend-following traders seeking confirmation.
- Trailing stop-loss strategies in trending markets.
4. Relative Strength Index (RSI)
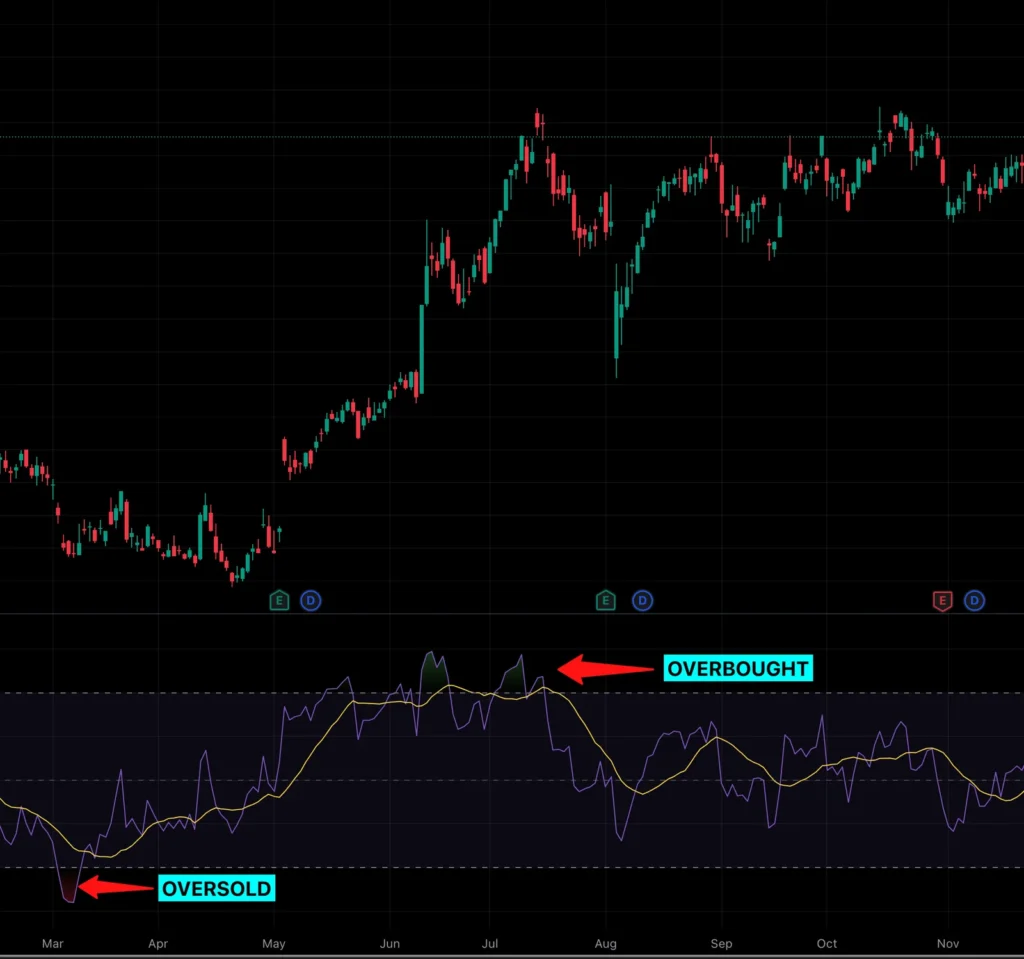
What It Does: Measures the momentum of price movements to detect overbought or oversold conditions on any chart.
Key Insight: When RSI drops below 30, the asset is considered oversold, presenting a potential buying opportunity. However, if RSI stays below 30 for an extended period, it may indicate continued bearish pressure.
Best Used For:
- Reversal traders spotting trend exhaustion.
- Confirming momentum shifts before entering options trades.
5. Bollinger Bands (BB)
What It Does: A volatility-based indicator that consists of a moving average and two standard deviation bands.
Key Insight: If price touches the lower Bollinger Band while RSI is oversold, it may signal a potential reversal. Conversely, if price consistently hugs the upper band, it indicates a strong uptrend.
Best Used For:
- Volatility-based options trading strategies.
- Identifying breakouts and mean reversions.
6. MACD (Moving Average Convergence Divergence)
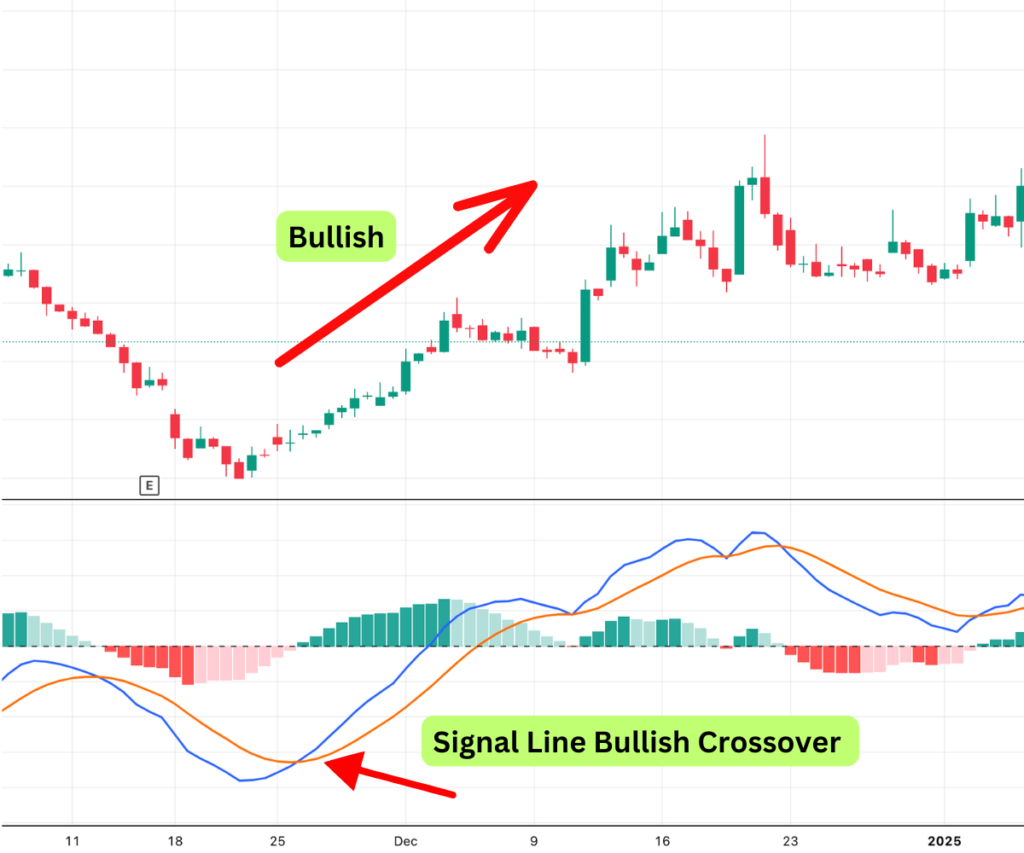
What It Does: Tracks momentum by comparing two EMAs and analyzing their convergence and divergence.
Key Insight: If the MACD line crosses above the signal line while ADX is above 20, it confirms a strong uptrend. However, if MACD signals bullish momentum but ADX is below 20, the trend may lack strength.
Best Used For:
- Momentum trading strategies.
- Confirming trend reversals with volume analysis.
7. Supertrend Indicator

What It Does: A trend-following indicator that provides clear buy and sell signals based on price movements.
Key Insight: If the Supertrend flips to green while price is above the 50 EMA, it strengthens the bullish case, meaning you can consider buying a CE position in Nifty, Bank Nifty or the index you want to trade.
However, during sideways markets, Supertrend can generate false signals, making it essential to use alongside other indicators.
Best Used For:
- Clear trend identification in trending markets.
- Setting stop-loss levels for safer exits.
8. VWAP (Volume Weighted Average Price)
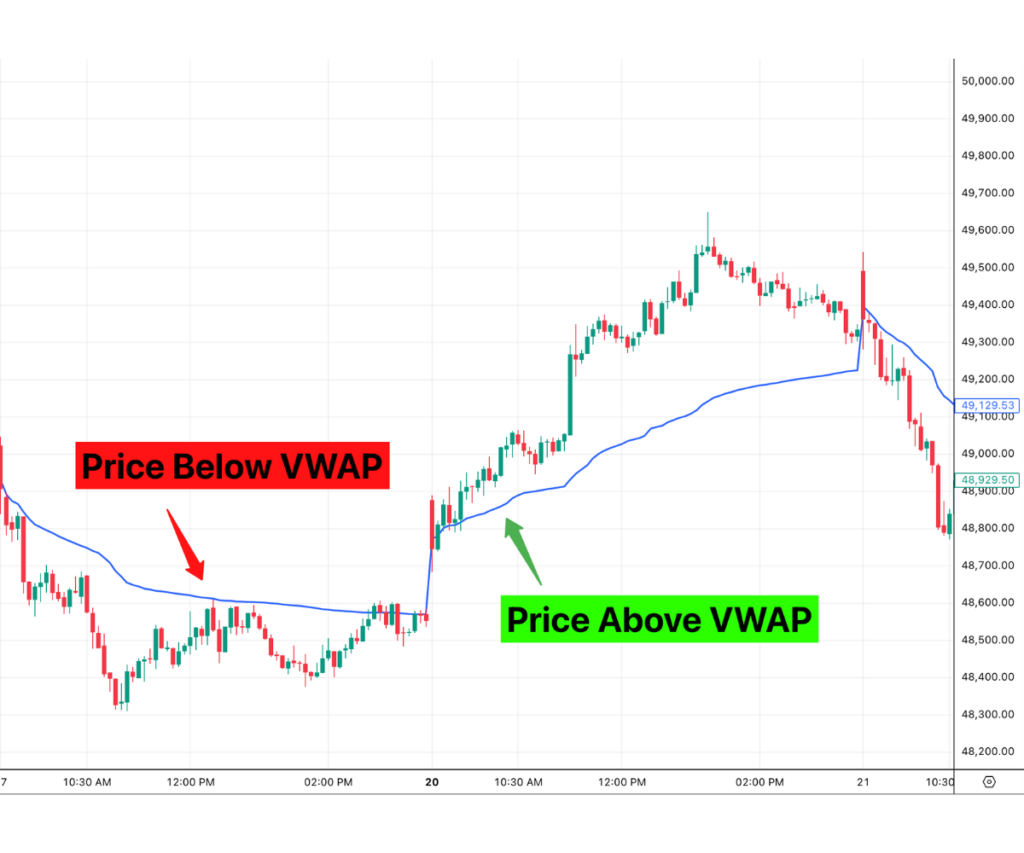
What It Does: Measures the average price of a security based on both volume and price.
Key Insight: If price is above VWAP, it indicates buying pressure, making call options favorable. Conversely, if price remains below VWAP with declining volume, put options may be considered.
Best Used For:
- Intraday traders executing options scalping strategies.
- Determining fair value areas for trade entries.
- Ideal for 1 minute to 15 minute time frames.
9. Average Directional Index (ADX)
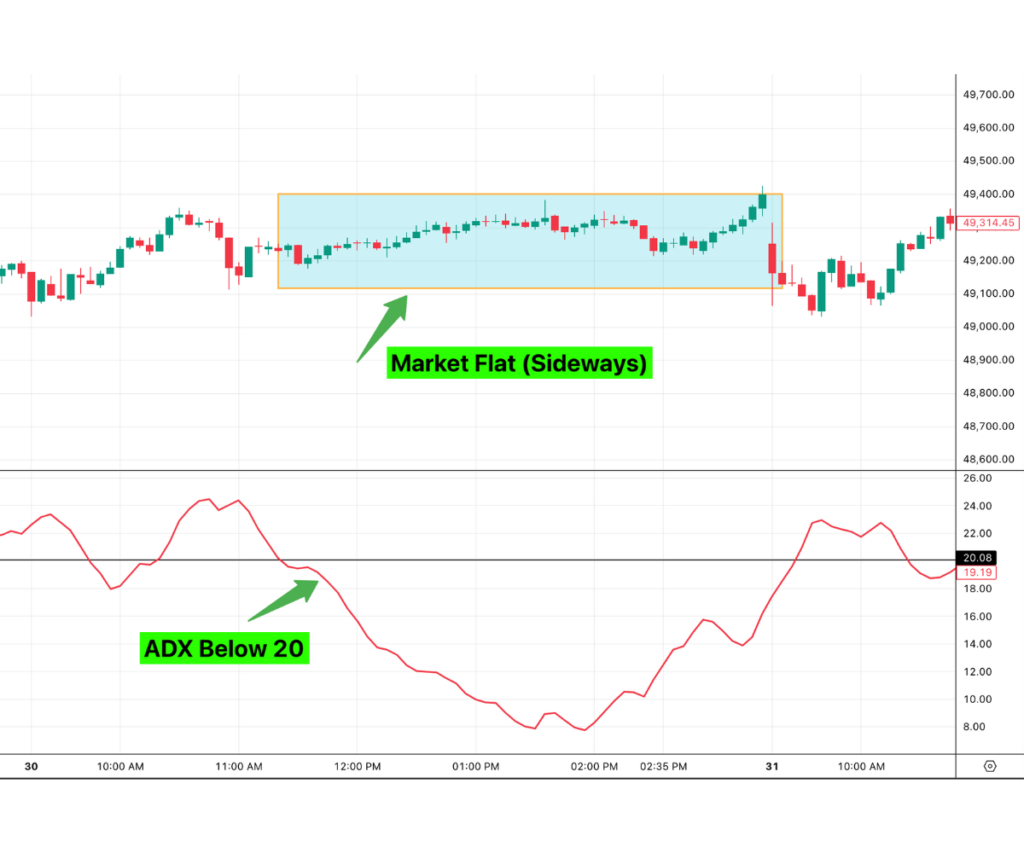
What It Does: Measures trend strength by analyzing the directional movement of any chart.
Key Insight: If ADX drops below 20, it is considered a weak trend, and traders should avoid taking trades until ADX rises above 20. A reading above 25 suggests a strong trend, making it ideal for directional trades.

This ensures that traders only enter positions when momentum is strong, reducing the risk of getting caught in sideways markets.
Best Used For:
- Avoiding low-momentum markets to prevent false breakouts.
- Confirming trend strength before entering options trades.
Indicator Comparison
Here’s a quick comparison of the best indicators for option trading:
| Indicator | Best Used For | Strengths | Weaknesses |
|---|---|---|---|
| Risological Options Indicator | Swing and positional trading | Captures big market movements | Requires patience, not for intraday traders or scalpers |
| Risological Swing Indicator | Swing trading | Clear entry/exit signals | Occasional false signals in high volatility |
| EMA | Trend identification | Reacts faster to price changes | Can generate false signals in choppy markets |
| RSI | Range-bound markets | Spots divergences and reversals | Less effective in trending markets |
| Bollinger Bands | Volatility-based setups | Identifies volatility expansions | False signals in choppy markets |
| MACD | Trending markets | Tracks momentum shifts | Less effective in sideways markets |
| Supertrend | Trend-following strategies | Simple and clear signals | False signals in volatile markets |
| VWAP | Intraday trading | Identifies fair value and sentiment | Less effective for swing trading |
| ADX | Confirming trend strength | Helps avoid weak trends | Not useful for predicting trend direction, unless using with DI+ and DI- |
Going Beyond Indicators in Option Trading
Indicators are like the tip of the iceberg in options trading.
What lies beneath is a world of derivatives, volatility, and Option Greeks—concepts that can make or break your trades. If you’re serious about trading options, you need to understand these hidden aspects.
Let’s break them down in simple terms.
1. Derivatives: The Building Blocks of Options
- What Are Derivatives?
Derivatives are financial instruments whose value is derived from an underlying asset, such as stocks, indices, or commodities. Options are a type of derivative. - Why Should You Care?
- Derivatives allow you to leverage your capital and take positions without owning the underlying asset.
- They’re also used for hedging, which is like buying insurance for your trades.
- Pro Tip:
- “Think of derivatives as a magnifying glass. They can amplify your profits, but they can also burn you if you’re not careful.”
2. India VIX: The Fear Gauge
- What Is India VIX?
India VIX, or the India Volatility Index, measures the market’s expectation of volatility over the next 30 days. It’s often called the fear gauge because it spikes during uncertain or bearish market conditions. - How Does It Impact Option Trading?
- High VIX: Option premiums increase because traders are willing to pay more for protection.
- Low VIX: Option premiums decrease as the market becomes more stable.
- Pro Tip:
- “When India VIX is high, it’s like a storm warning. Be cautious and adjust your strategies accordingly.”
3. Option Greeks: The DNA of Your Trades
Option Greeks are metrics that help you understand how different factors—like price, time, and volatility—affect your options. Let’s break them down:
- Delta (Δ): The Speedometer
- Measures how much the option price changes relative to the underlying asset.
- Example: If Delta is 0.5, the option price moves ₹0.50 for every ₹1 move in the underlying.
- Pro Tip: “Delta tells you how fast your option is moving. A high Delta means you’re in the fast lane.”
- Gamma (Γ): The Accelerator
- Measures the rate of change of Delta.
- Example: If Gamma is 0.10, Delta increases by 0.10 for every ₹1 move in the underlying.
- Pro Tip: “Gamma is like the turbo boost. It tells you how quickly your Delta can change.”
- Theta (Θ): The Ticking Time Bomb
- Measures the rate of decline in the option’s value due to the passage of time.
- Example: If Theta is -0.05, the option loses ₹0.05 in value each day.
- Pro Tip: “Theta is the silent killer. It eats away at your option’s value every day, so plan your trades accordingly.”
- Vega (ν): The Mood Swing
- Measures the option’s sensitivity to changes in volatility.
- Example: If Vega is 0.10, the option price increases by ₹0.10 for every 1% increase in implied volatility.
- Pro Tip: “Vega is like the market’s mood swings. When volatility spikes, Vega can work in your favor—or against you.”
- Rho (ρ): The Interest Rate Factor
- Measures the option’s sensitivity to changes in interest rates.
- Example: If Rho is 0.05, the option price increases by ₹0.05 for every 1% increase in interest rates.
- Pro Tip: “Rho is the least talked about Greek, but it can still impact your trades, especially in a rising interest rate environment.”
Option Greeks Cheat Sheet
Here’s a quick reference guide to Option Greeks:
| Greek | What It Measures | Example | Pro Tip |
|---|---|---|---|
| Delta (Δ) | Price change relative to the underlying | Delta of 0.5 = ₹0.50 move for every ₹1 in underlying | “High Delta = Fast lane” |
| Gamma (Γ) | Rate of change of Delta | Gamma of 0.10 = Delta increases by 0.10 for every ₹1 move | “Gamma = Turbo boost” |
| Theta (Θ) | Time decay of the option | Theta of -0.05 = Loses ₹0.05 per day | “Theta = Silent killer” |
| Vega (ν) | Sensitivity to volatility changes | Vega of 0.10 = ₹0.10 increase for every 1% volatility rise | “Vega = Market mood swings” |
| Rho (ρ) | Sensitivity to interest rate changes | Rho of 0.05 = ₹0.05 increase for every 1% interest rate rise | “Rho = Least talked about but still matters” |
Why 90% of Options Traders Lose Money?
Now that we’ve covered the tools and concepts, let’s address the elephant in the room: Why do over 90% of the option traders lose money?
1. Indicators Aren’t a Magic Pill
- Many traders think that using the best indicators will guarantee profits. But here’s the truth: Indicators are just tools.
- They can’t compensate for poor risk management, lack of discipline, or emotional decision-making.
2. Lack of Discipline
- The profitable 10% have one thing in common: discipline.
- They stick to their trading plan, avoid overtrading, and don’t let emotions dictate their actions.
- They set realistic goals and dont aim for 100% return on a daily basis, or ZERO to HERO trades.
- Pro Tip: “Trading is like a marathon, not a sprint. Slow and steady wins the race.”
3. Poor Risk Management
- The losing 90% often risk too much on a single trade, hoping for a big win.
- The winning 10% risk 1-5% of their capital per trade and focus on preserving their capital.
- Pro Tip: “Risk management is like wearing a seatbelt. It might feel unnecessary until it saves your life.”
4. Emotional Trading
- Fear and greed are the biggest enemies of traders.
- The losing 90% chase profits and cut winners short, while the winning 10% stay calm and stick to their strategy.
- Pro Tip: “Trading is like a relationship. If you let emotions take over, it’s bound to end badly.”
How to Choose the Best Options Indicator for Your Trading Style
Not all traders are created equal. Some have the time and focus to trade intraday, while others prefer swing or positional trading. The key to success is aligning your indicators with your trading style and lifestyle. Here’s how to choose the best options indicator for your needs:
1. Intraday Traders (Same Day Open & Exit)
- Who Are They?
Traders who open and close positions within the same trading session. The 1 minute to 15 minute time frame, super-charged trading category! - Best Indicators:
- VWAP (Volume Weighted Average Price): Helps identify fair value and intraday trends.
- Supertrend: Provides clear buy/sell signals for quick decision-making.
- Risological Options Trading Indicator: Captures intraday momentum and reversals.
- Pro Tip: “Intraday trading is like a sprint. You need quick, reliable tools to stay ahead.”
2. Swing Traders (BTST to Few Weeks)
- Who Are They?
Traders who hold positions for a few days to weeks, aiming to capture medium-term price movements. These are usually the 1 hour to 4 hour time frame trades. - Best Indicators:
- Risological Swing Trading Indicator: Tailored for swing trading with clear entry/exit signals.
- MACD: Tracks momentum shifts and trend reversals.
- Bollinger Bands: Identifies volatility-based setups for swing trades.
- Pro Tip: “Swing trading is like a road trip. You need a reliable map (indicator) to navigate the twists and turns.”
3. Positional Traders (Long-Term: Few Months to Many Years)
- Who Are They?
Traders who hold positions for months to decades, focusing on long-term trends. These are the Daily, Weekly or Monthly time frame traders. - Best Indicators:
- Moving Averages (MA/EMA): Helps identify long-term trends and support/resistance levels.
- RSI: Spots overbought/oversold conditions for potential reversals.
- Option Greeks (Delta, Theta, Vega): Essential for managing long-term options strategies.
- Pro Tip: “Positional trading is like planting a tree. You need patience and the right tools to watch it grow.”
FAQ Section
Here are answers to some of the most common questions about options trading and indicators:
What is the best indicator for option trading?
There’s no one-size-fits-all answer. The best indicator depends on your trading style and goals. For intraday trading, VWAP and Supertrend are great choices. For swing trading, consider the Risological Swing Trading Indicator or MACD.
How do I use indicators for Nifty and BankNifty option trading?
For Nifty, focus on indicators like RSI and Bollinger Bands to identify trends and reversals.
For BankNifty, which is more volatile, use Risological Options Trading Indicator or MACD to capture momentum.
Can Risological indicators be used for intraday trading?
Yes! The Risological Options Trading Indicator is designed to capture intraday momentum and reversals, making it a powerful tool for intraday traders.
What are the best indicators for swing trading options?
The Risological Swing Trading Indicator, MACD, and Bollinger Bands are excellent choices for swing trading.
How do I avoid common mistakes when using trading indicators?
Avoid overloading your chart with too many indicators. Stick to 2-3 that complement each other.
Always combine indicators with risk management and market context.
Test your strategy on a demo account before going live.
What are Option Greeks, and why are they important?
Option Greeks (Delta, Gamma, Theta, Vega, Rho) measure how different factors affect your options. They’re essential for understanding risk and managing your trades effectively.
How does India VIX impact option trading?
India VIX measures market volatility. When VIX is high, option premiums increase, and when it’s low, premiums decrease. Use it to gauge market sentiment and adjust your strategies accordingly.
Conclusion
Trading options isn’t easy, but with the right tools and mindset, you can tilt the odds in your favor. Remember, indicators are just one piece of the puzzle. To succeed, you need discipline, risk management, and a deep understanding of the market.
In this post, we’ve covered:
- The best indicators for option trading, including the powerful Risological Options Trading Indicator and Risological Swing Trading Indicator.
- The hidden aspects of options trading, like derivatives, India VIX, and Option Greeks.
- Why 90% of traders lose money and how you can be part of the profitable 10%.
- How to choose the best indicator for your trading style.
Now it’s your turn. Take what you’ve learned, test it in a demo account, and refine your strategy. And if you’re ready to take your trading to the next level, explore the Risological indicators—they might just be the game-changer you’ve been looking for.
Some Final Motivation
Ready to transform your trading?
Try the Risological Indicators today and see the difference for yourself.
Whether you’re trading Nifty, BankNifty, or global indices like DJI, these tools are designed to help you capture big market movements and stay ahead of the curve.
Wish you good luck!